Data Source Performance
With polling data sources such as Modbus, BACnet, SNMP, and SQL, performance tuning is critical to ensure reliable data collection. If a poll takes longer than the configured poll period, the next poll will be aborted, resulting in gaps in your data. This page explains how to monitor performance, interpret the metrics Mango provides, and resolve common performance problems.
Checking Runtime Status
When editing any polling data source, open the Runtime status section to view live performance metrics.
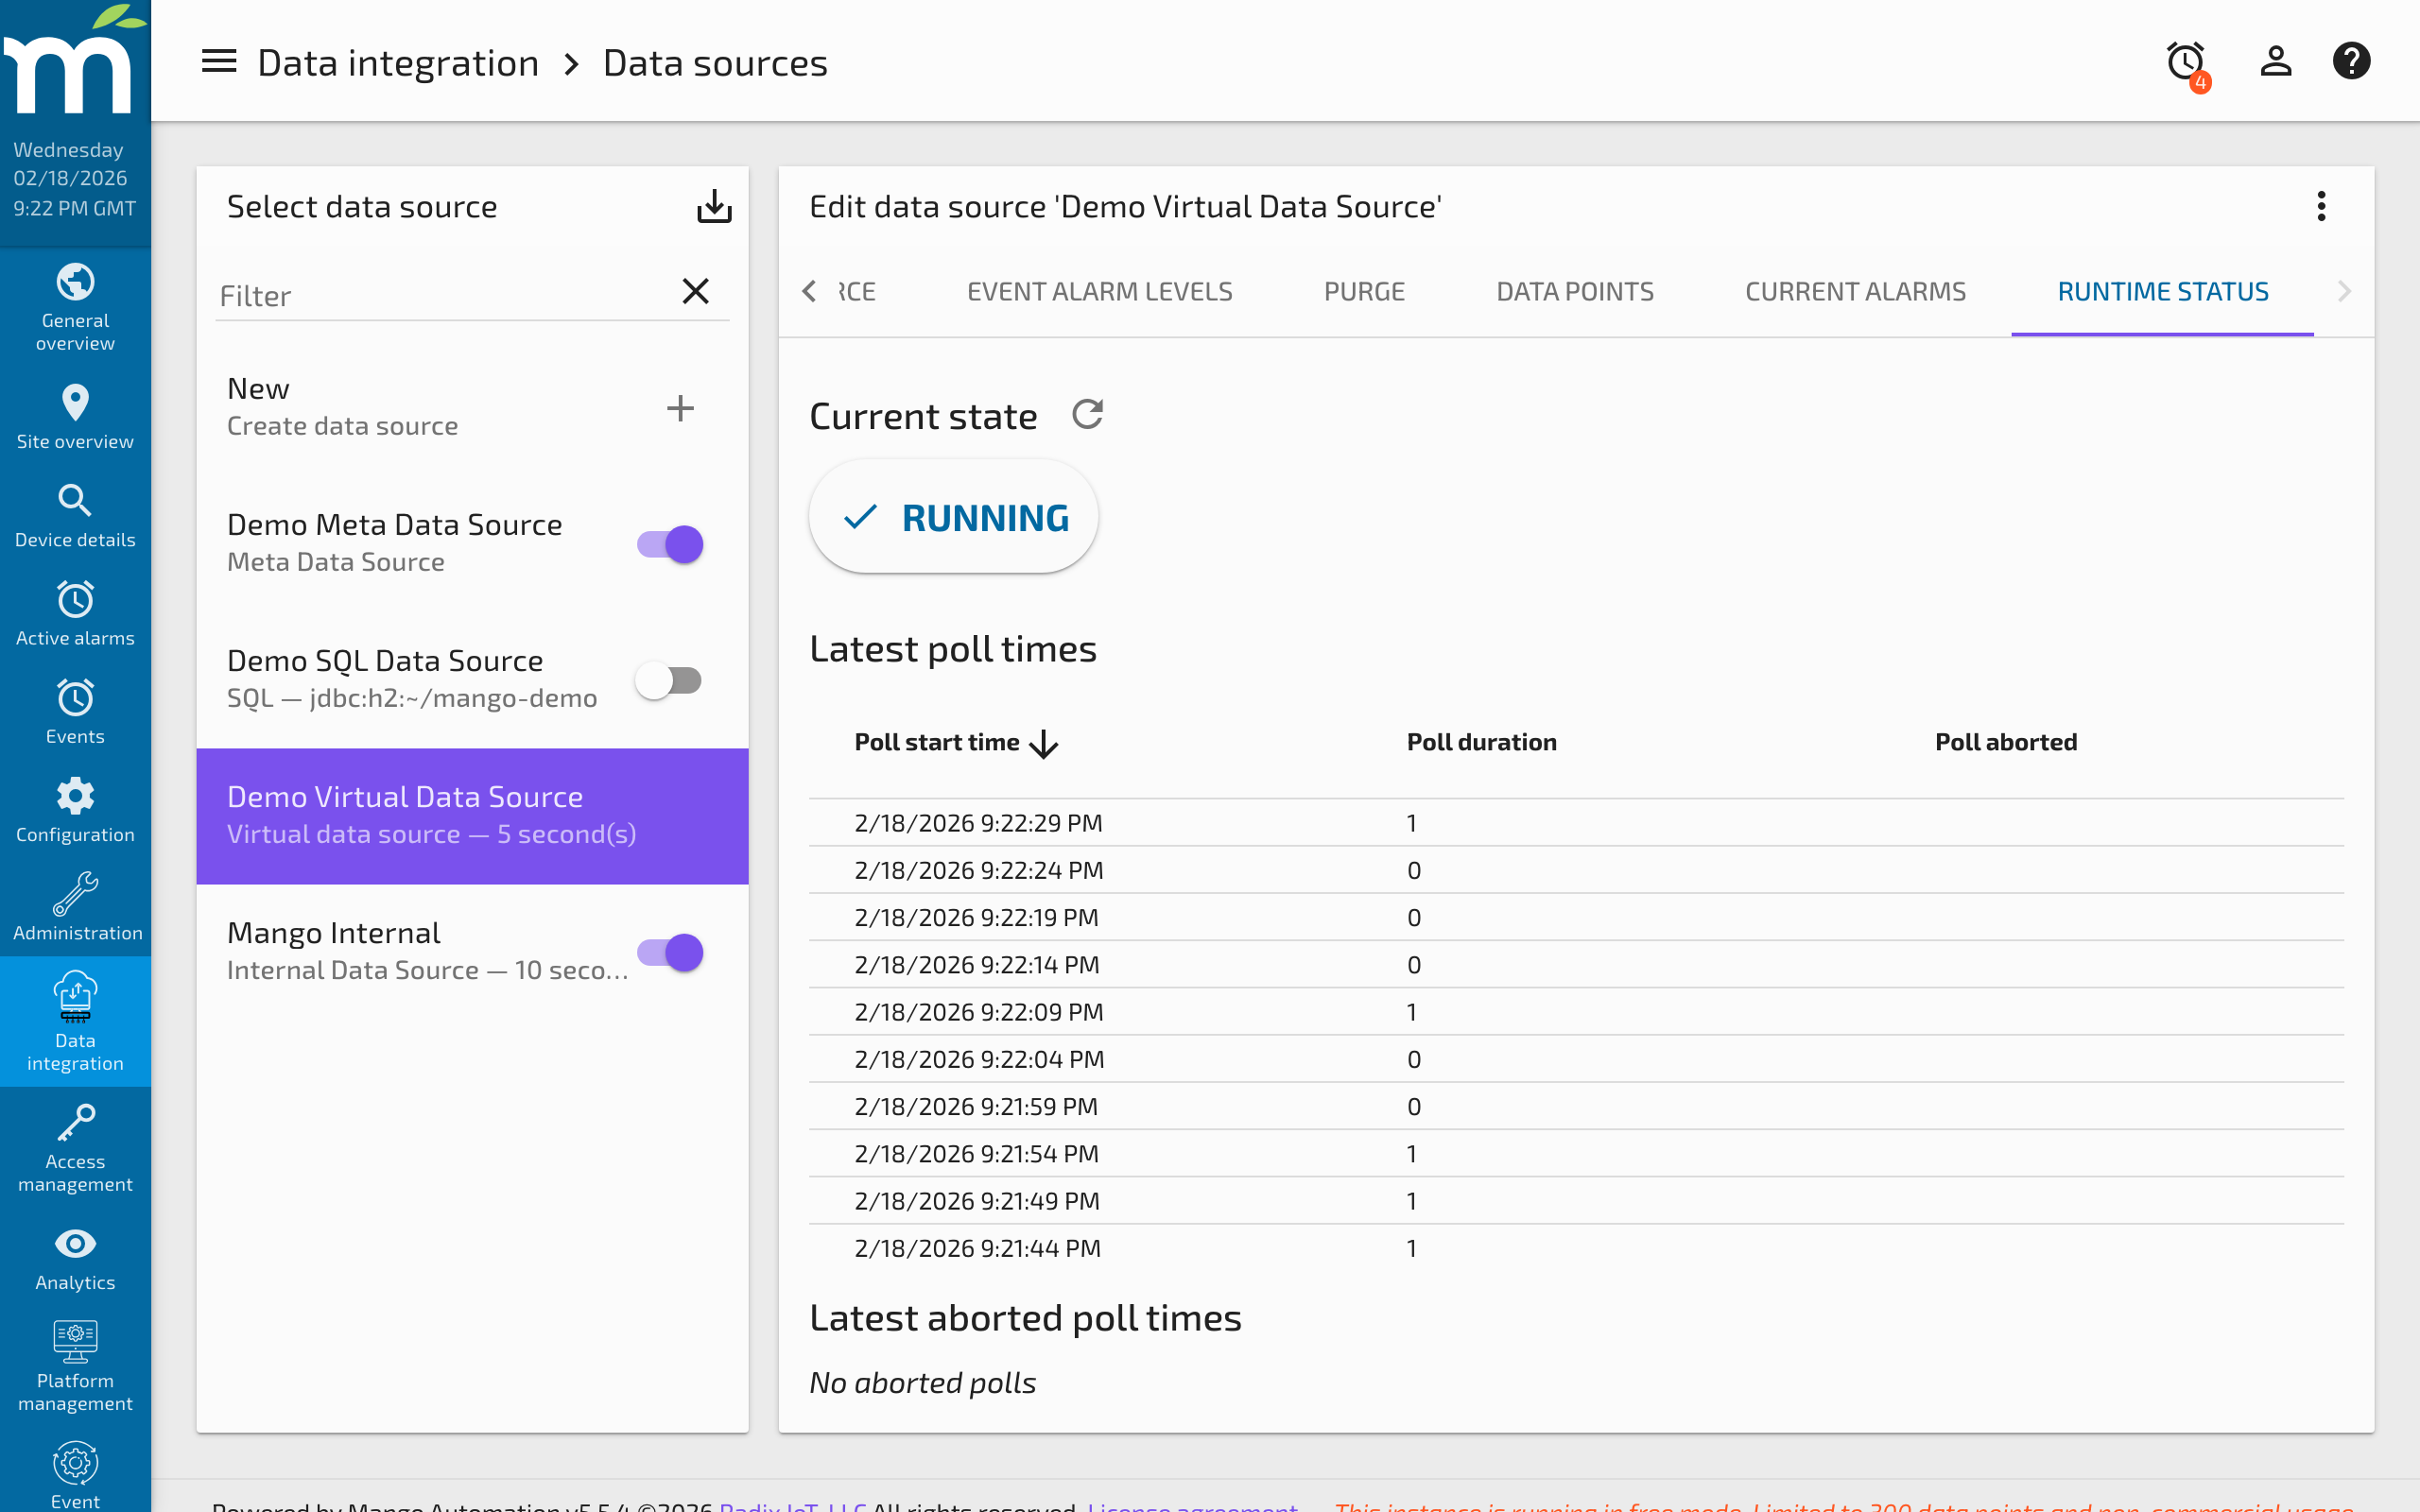
The key metrics are:
| Metric | Description |
|---|---|
| Poll duration | How long the most recent poll took to complete (in milliseconds). |
| Average poll duration | The running average over the last several polls. |
| Polls aborted | The number of polls that were skipped because the previous poll had not yet completed. |
| Poll success count | Total number of successful polls since the data source was started. |
The Golden Rule: Poll Period vs. Poll Duration
The most important performance principle is:
Your poll period must be greater than your poll duration.
If you have a data source set to poll every 1 second, but the poll consistently takes 1.5 seconds to complete, every other poll will be aborted. This means you are effectively collecting data at half your intended rate, with no warning in the point values themselves -- you must check the runtime status or event log to discover the problem.
Accounting for Timeouts
The total worst-case poll duration includes the time spent waiting for timeouts and retries. For example, with a Modbus data source that makes 10 register requests per poll:
- Timeout: 1000 ms
- Retries: 2
- Worst-case time per request: 1000 ms x (1 + 2 retries) = 3000 ms
- Worst-case poll duration: 10 requests x 3000 ms = 30 seconds
If the device is unresponsive, the poll will take 30 seconds to fail completely. With a 5-second poll period, the next 5 polls will be aborted while the timeout completes. Set your timeout and retry values such that:
timeout x (1 + retries) x number_of_requests < poll_period
Diagnosing Slow Polls
Step 1: Check the Runtime Status
Open the data source editor and look at the runtime status. If the average poll duration is close to or exceeds the poll period, you have a problem.
Step 2: Enable I/O Logging
For protocol data sources like Modbus, enable the Log IO checkbox in the data source settings. This creates a log file in the Mango logs directory named according to the pattern <protocol>IO-<dataSourceId>.log. The I/O log shows every request sent (O) and response received (I) with timestamps, allowing you to:
- See how many individual requests are made per poll
- Measure response times for each request
- Identify whether requests are being batched efficiently
- Spot devices that are slow to respond or timing out
Step 3: Analyze Request Batching
Many protocols (particularly Modbus) can batch multiple point values into a single request. If your I/O log shows a constant stream of individual requests with no clear grouping by poll cycle, the data source is likely not batching effectively. Check settings like Contiguous batches only, Max read register count, and Max read bit count to improve batching.
A well-tuned data source will show tight clusters of requests (one per poll cycle) separated by the poll interval. A poorly tuned data source will show an unbroken stream of requests with no visible gaps.
Optimization Strategies
Increase the Poll Period
The simplest fix is to poll less frequently. If your data does not change faster than once every 5 seconds, there is no benefit to polling every 1 second. A longer poll period gives the data source more time to complete each cycle.
Improve Request Batching
For Modbus data sources, ensure that Contiguous batches only is unchecked (unless your device requires it). Increase Max read register count to allow the library to combine more registers into a single request. Fewer requests per poll means faster polls.
Split Into Multiple Data Sources
If a single data source has too many points to poll within the desired period, split the points across two or more data sources. Each data source runs its own poll cycle independently. For example, you could put fast-changing points (temperatures, pressures) in one data source polling every second, and slow-changing points (configuration values, status flags) in another polling every 30 seconds.
Reduce Timeouts and Retries
If devices are reliably connected, reduce the timeout from the default value and minimize retries. This reduces the worst-case poll duration when a single request fails.
Use Event-Driven Collection
Where possible, switch from polling to event-driven collection. BACnet supports COV (Change Of Value) subscriptions, and MQTT is inherently event-driven. These approaches eliminate wasted polls when values have not changed.
Monitoring for Problems
Configure event handlers on the Poll aborted alarm for each data source. This ensures you are notified immediately when a data source cannot keep up with its poll period, rather than discovering the problem days later when reviewing historical data.
You can also use the Internal data source to monitor Mango's own performance, including JVM heap usage, thread counts, and data source statistics. Adding internal data points for each critical data source gives you a historical record of performance that you can trend and alarm on.
Summary
| Problem | Symptom | Solution |
|---|---|---|
| Polls being aborted | Poll duration exceeds poll period | Increase poll period, improve batching, or split data source |
| High timeout impact | Long poll duration when device is down | Reduce timeout and retry values |
| Poor batching | I/O log shows constant stream of requests | Uncheck contiguous batches only, increase max register count |
| Too many points | Poll duration grows with point count | Split points across multiple data sources |
| Device slow to respond | Long gaps between request and response in I/O log | Check device load, network latency, or firmware |
Related Pages
- Data Sources Overview — General data source and data point concepts
- Modbus Data Source — Detailed batching and I/O logging configuration for Modbus polling
- Internal Data Source — Monitor per-data-source poll duration and success metrics
- High CPU Usage — Diagnose CPU issues caused by excessive polling or thread pool exhaustion
- NoSQL Task Queue Full — Resolve write-behind bottlenecks from high-throughput data collection