Rollup UI Component
Rollup controls in the Mango UI determine how point value data is aggregated for display on charts, tables, and other components. By default, Mango automatically selects an appropriate rollup interval based on the time range and display context, but you can override this behavior for more control.
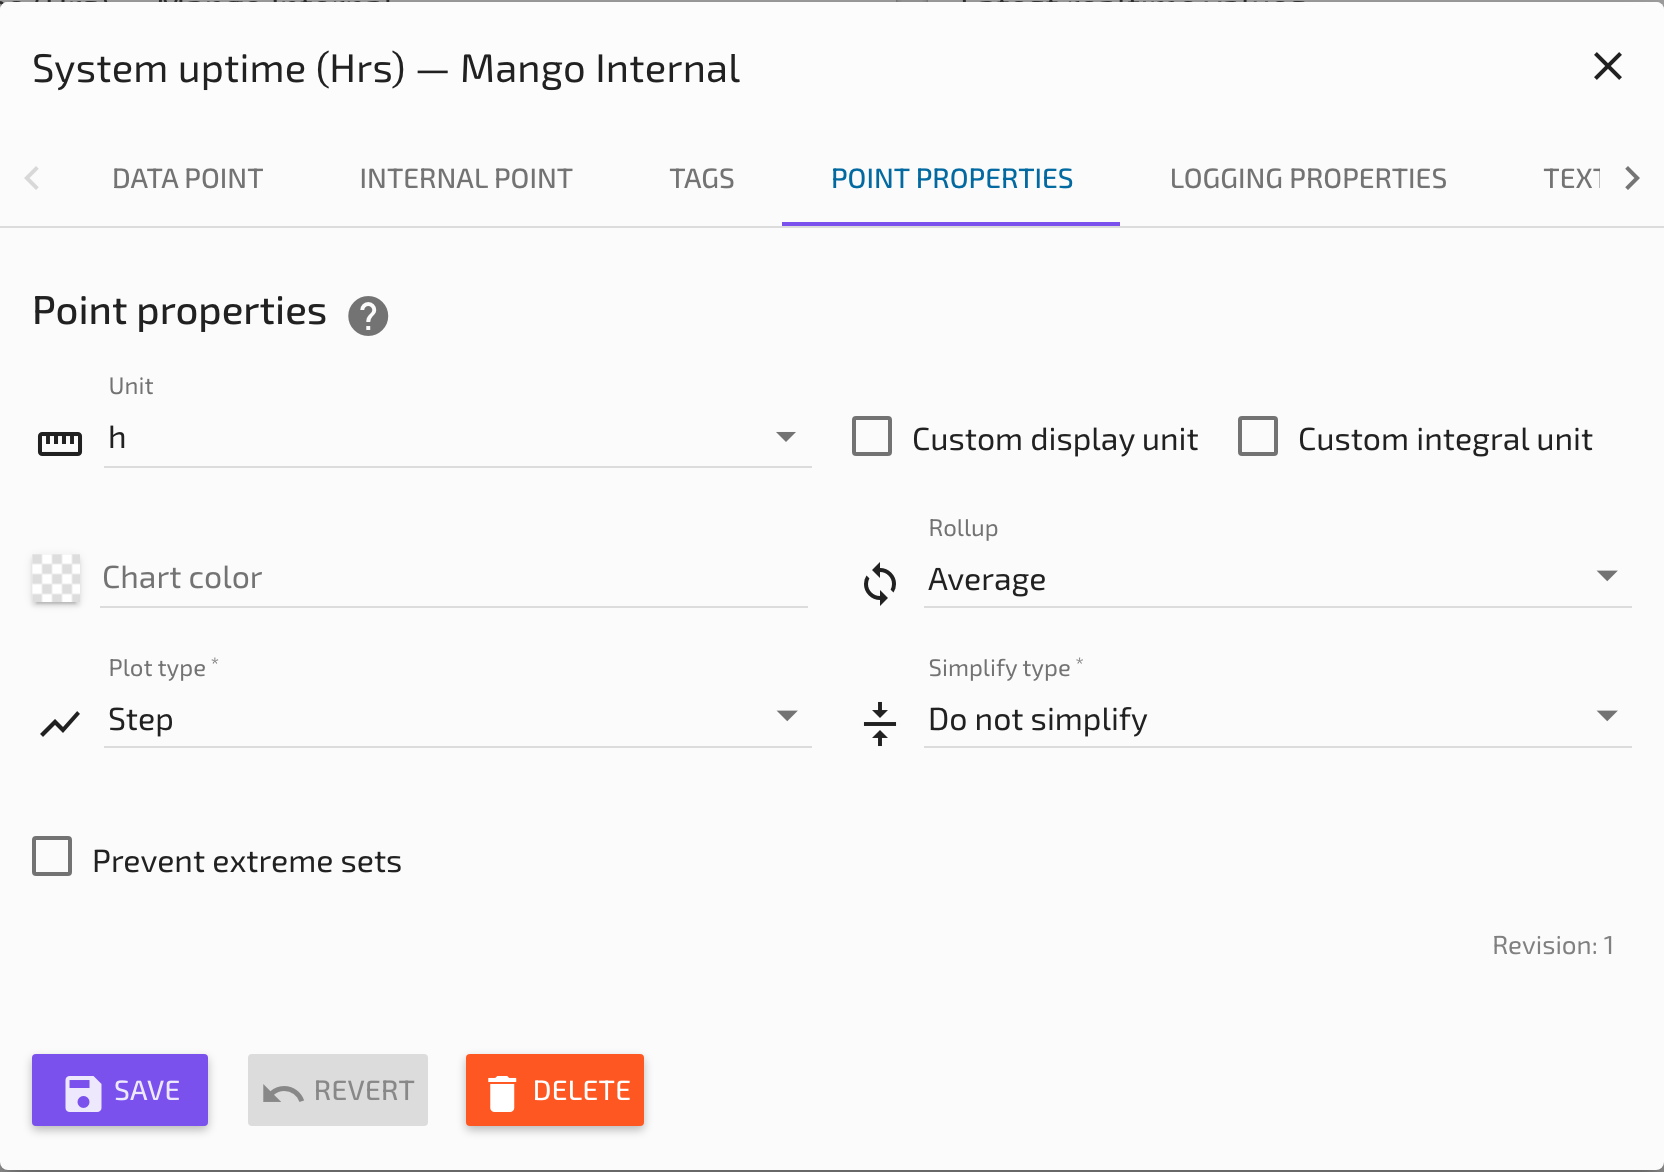
Per-Point Default Rollup
Each data point can have a default rollup, plot type, and simplify setting configured in its properties. These defaults are used throughout the UI whenever the chart or component requests a "Point default" rollup.
To configure the default rollup for a data point:
- Edit the data point and navigate to the Properties tab.
- Set the Rollup type (e.g., Average, Delta, Maximum).
- Set the Rollup period and Rollup period type (e.g., 1 Hour, 15 Minutes).
- Optionally configure Plot type (Line, Smooth, Step, Bar).
- Optionally configure Simplify settings.
- Save the data point.
Common Rollup Configurations by Use Case
| Use Case | Rollup Type | Why |
|---|---|---|
| Counter/meter (kWh, gallons) | Delta | Shows consumption per period rather than the running total |
| Totalized value | Sum | Shows the total amount consumed in each period |
| Analog signal (temperature, kW, pressure) | Average | Shows the representative value for each period |
| Analog signal (for peak detection) | Maximum or Minimum | Shows extremes for capacity planning |
| Analog signal (high-frequency) | None with Simplify | Preserves peaks and valleys without averaging |
Date Bar Rollup Controls
Rollup settings appear in the Date Bar (Header Bar) at the top of the page when the current view supports rollups. The Events page, for example, does not show rollup controls because rollups do not apply to event data.
Auto Rollup
By default, Auto rollup is enabled. Mango automatically calculates an appropriate rollup interval based on the selected time range and the chart width. This ensures that a reasonable number of data points are displayed without requiring manual configuration.
Manual Rollup Override
Turn off Auto rollup to manually specify:
- Rollup type -- Select the aggregation method: Average, Delta, Maximum, Minimum, Sum, Count, First, Last, Start, Accumulator, Integral, or None.
- Rollup interval -- The number and period type (e.g., 30 Minutes, 1 Hour, 1 Day).
If the selected data point is non-numeric, the rollup type will automatically be set to None and only compatible types (Count, First, Last, Mode, Runtime, Proportion, Starts) will be available.

Rollup Axioms
Understanding these foundational rules helps avoid confusion when interpreting rollup results:
- A start time is inclusive; an end time is exclusive. A period from 08:00 to 09:00 includes values at exactly 08:00 but not at exactly 09:00.
- Every period starts with the value that existed prior to the period as though it were timestamped at the start of the period, unless a value exists at the exact start time.
- Periods with no prior value have a NULL start value. This can result in NaN for some statistics.
- No prior value and no values in the period: All statistics are NaN except Count and Sum (which are 0), and First/Last (which are NULL).
- No statistic requires a value from the next period. Each period is self-contained.
- The end value is the last value within the period. If no values exist in the period, the end value is the start value.
- Previous value is the latest value strictly before the period start.
Date Truncation
Rollup queries can have their from and to times truncated to clean boundaries using the truncate=true parameter. Truncation rounds down to the nearest period boundary:
| Period | Truncation Rule |
|---|---|
| Years | Rounds to January 1st of the year |
| Months | Rounds to the 1st of the month |
| Weeks | Rounds to the start of the aligned week of the year |
| Days | Rounds to midnight (start of the day) |
| Hours | Rounds to the start of the hour |
| Minutes | Rounds to the start of the minute |
| Seconds | Rounds to the start of the second |
For example, querying with a 1-hour rollup and truncate=true when the from time is 08:37 will adjust it to 08:00.
Simplify Algorithm
The Simplify option is an alternative to rollups designed for numeric data points. Instead of aggregating values into fixed-interval buckets, the algorithm reduces the number of data points while preserving the overall shape of the signal. Important peaks, valleys, and transitions are kept; redundant intermediate points are removed.
How Simplify Works
The algorithm evaluates each data point in the series and determines whether removing it would significantly alter the visual appearance of the line. Points that lie close to the straight line between their neighbors are candidates for removal.
Configuration
- Target -- The desired number of output data points. For example, if you have 40,000 raw values in a month and set a target of 1,000, the algorithm will attempt to reduce the dataset to approximately 1,000 points.
- Tolerance -- An optional fine-tuning parameter. Specifies the minimum deviation (in the point's units) that a data point must represent to be retained. Points whose removal would change the signal by less than the tolerance are more likely to be removed.
When to Use Simplify vs. Rollups
| Scenario | Recommendation |
|---|---|
| Need fixed-interval summary data (hourly avg, daily max) | Use Rollups |
| Need to preserve signal shape for visual analysis | Use Simplify |
| Need to detect short transient events in long time ranges | Use Simplify |
| Need data for calculations or export to external systems | Use Rollups |
| Displaying high-frequency data on a dashboard chart | Use Simplify with a target matching the chart's pixel width |
Auto-Update and Refresh
When using preset time ranges (e.g., "Last 5 minutes," "Last 1 hour") rather than custom date ranges, the Date Bar shows auto-update options:
- Auto update checkbox -- When enabled, the time range automatically refreshes at the configured interval.
- Update interval -- How often to refresh (e.g., every 5 seconds, every 30 seconds, every minute).
- Manual refresh -- Click the reload icon on the Date Bar to immediately refresh the data.
Auto-update is useful for live monitoring dashboards where you want charts to continuously show the most recent data.
Related Pages
- Rollups and Statistics — Complete reference for all rollup types and statistical calculations
- Watch List Charts — Use rollup and simplify settings when charting data from watch lists
- Data Point Properties Reference — Set per-point default rollup type, plot type, and simplify settings
- Watch Lists Overview — View and chart data points with configurable date ranges and rollups