Watch List
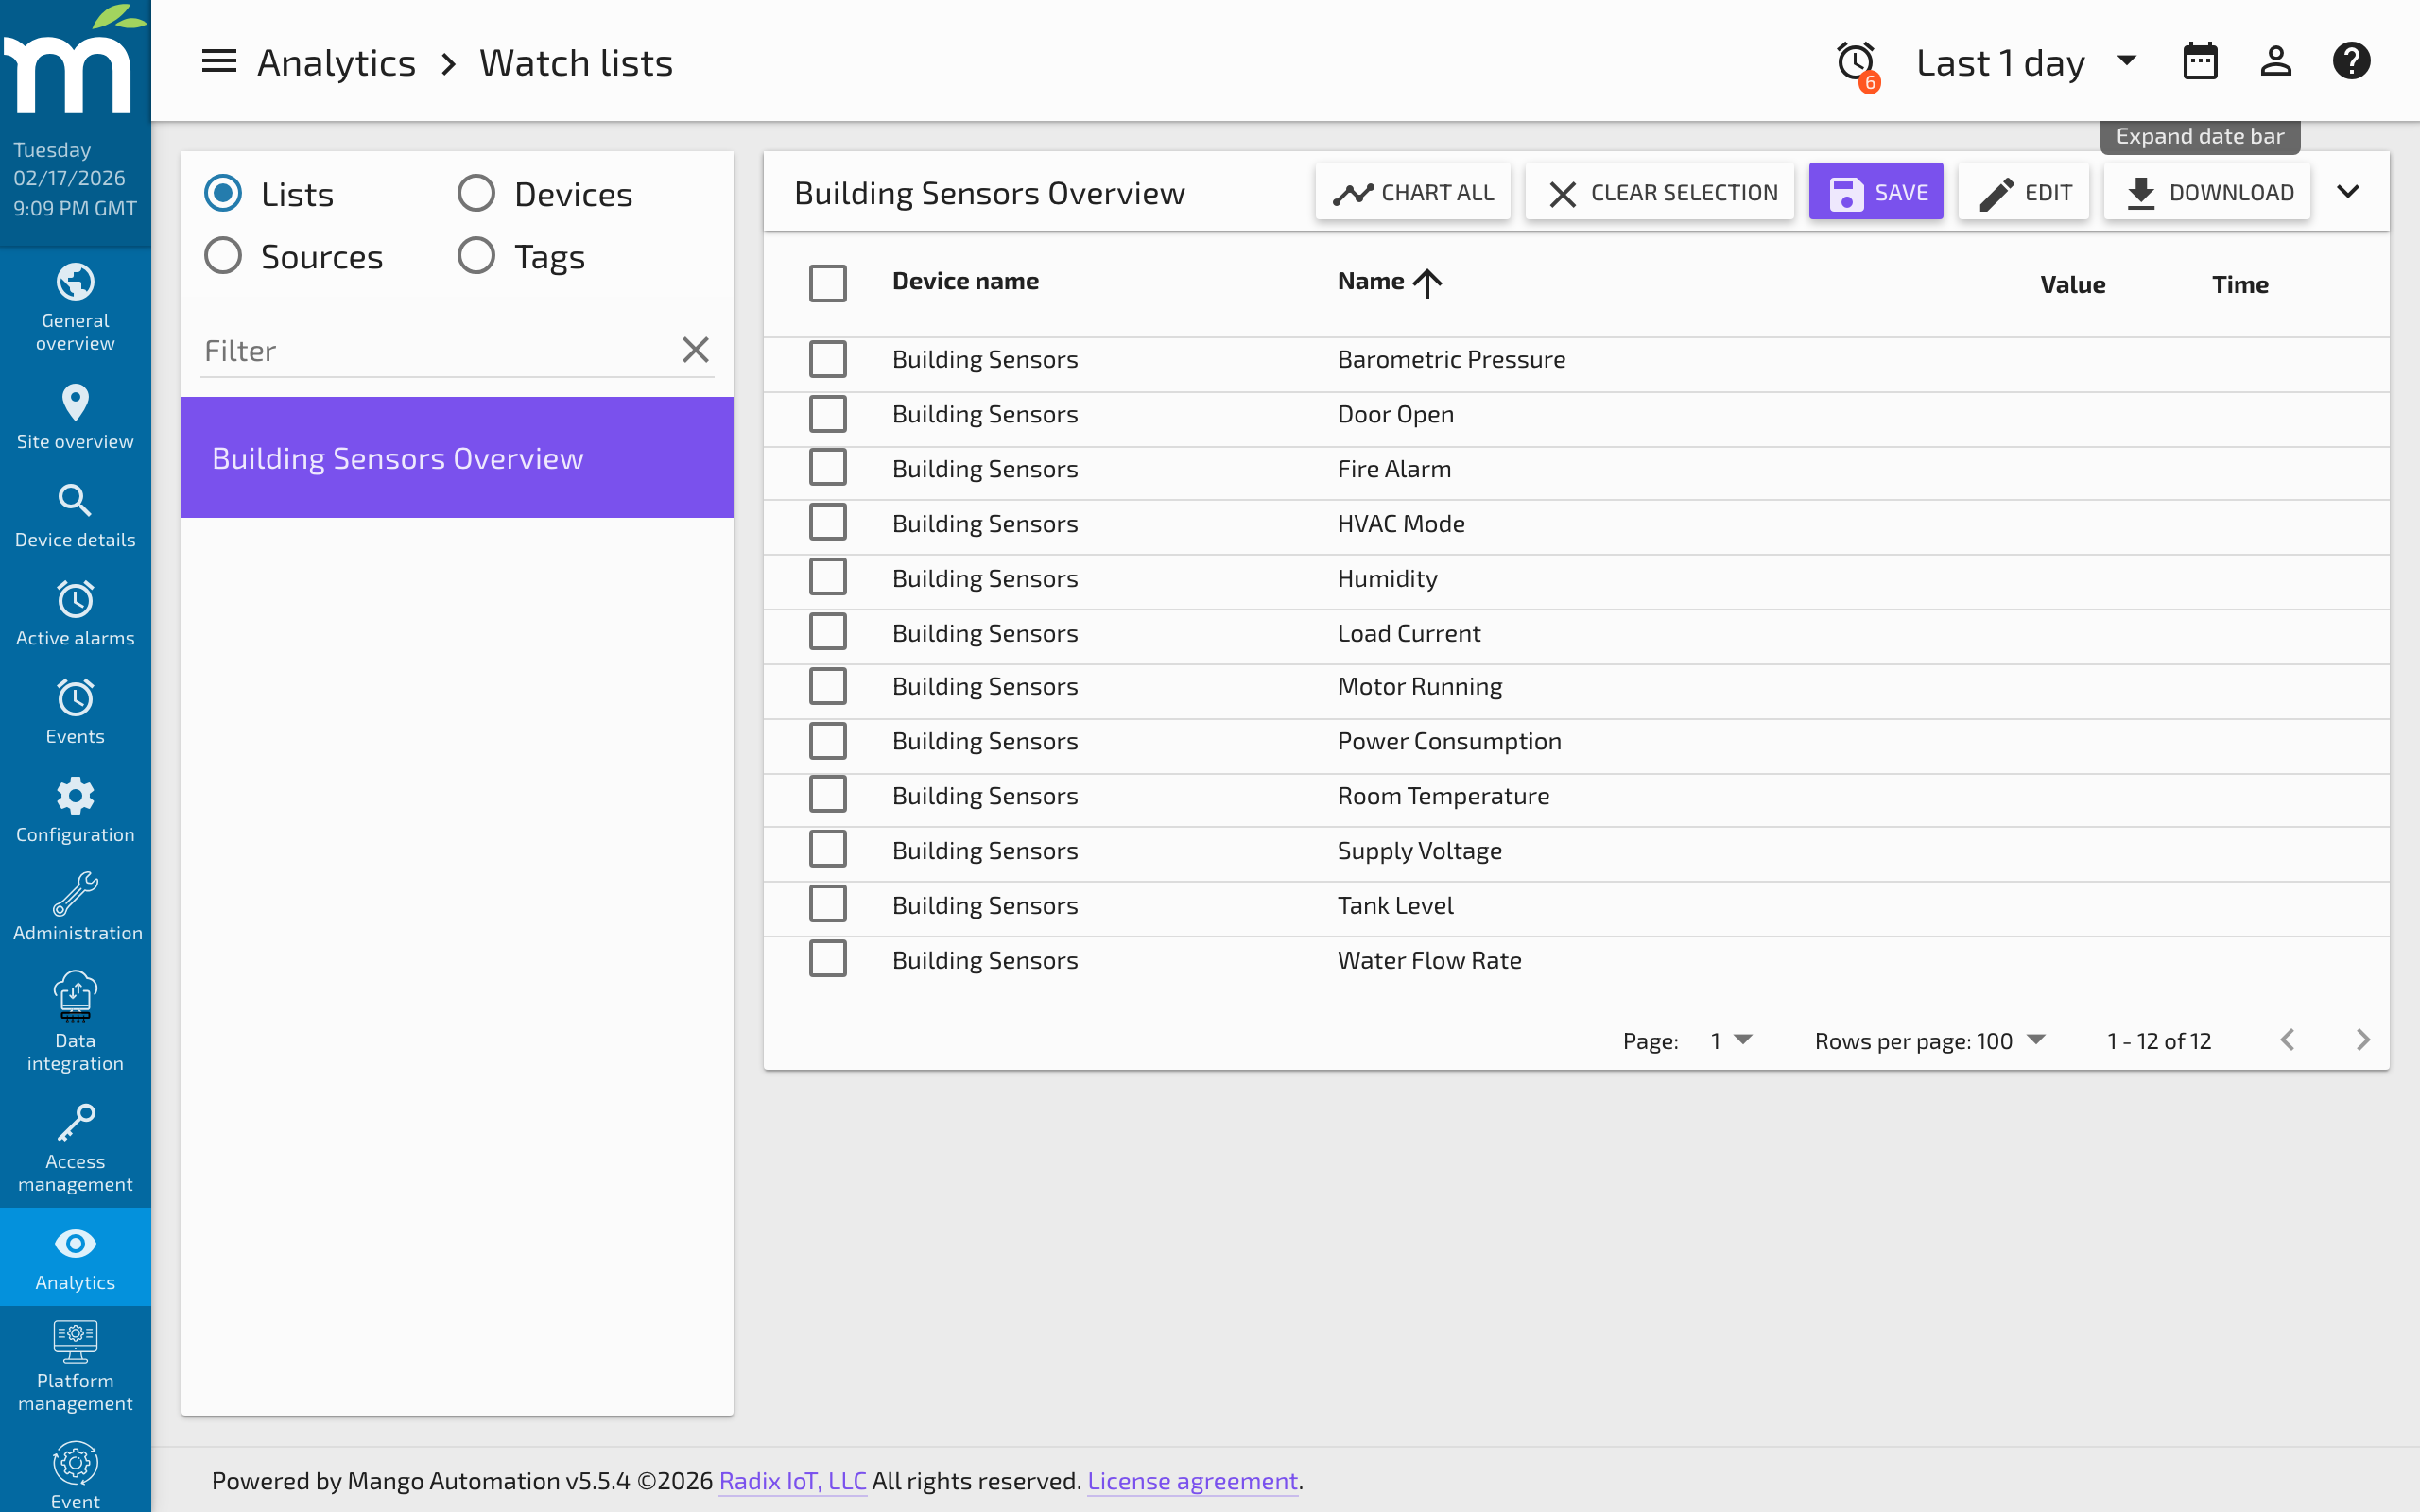
The Watch List page allows you to view and compare many data points at the same time in a table format. Powerful query-based and parameter-driven watch lists can be built using the Watch List Builder, and then viewed on this page.
Selecting a Watch List
On the left side of the Watch List page, you can choose between several ways to select data points:
- Lists -- Custom watch lists created with the Watch List Builder. These can be static or dynamic query-based lists.
- Devices -- Groups data points by their device name. Every data point has a device name (typically the name of the equipment or machine it is associated with), which can be edited on the data point's properties.
- Sources -- Groups data points by their data source. Every data point belongs to exactly one data source.
- Tags -- Groups data points by their tag values. Tags provide a more flexible grouping mechanism than device names or sources, allowing points to be organized across multiple dimensions simultaneously.
Choosing a new list, device, source, or tag group clears the current chart and loads the corresponding data points into the table view.
If the selected watch list has not been saved yet, clicking Save will open the Watch List Builder page where you can configure and save it.
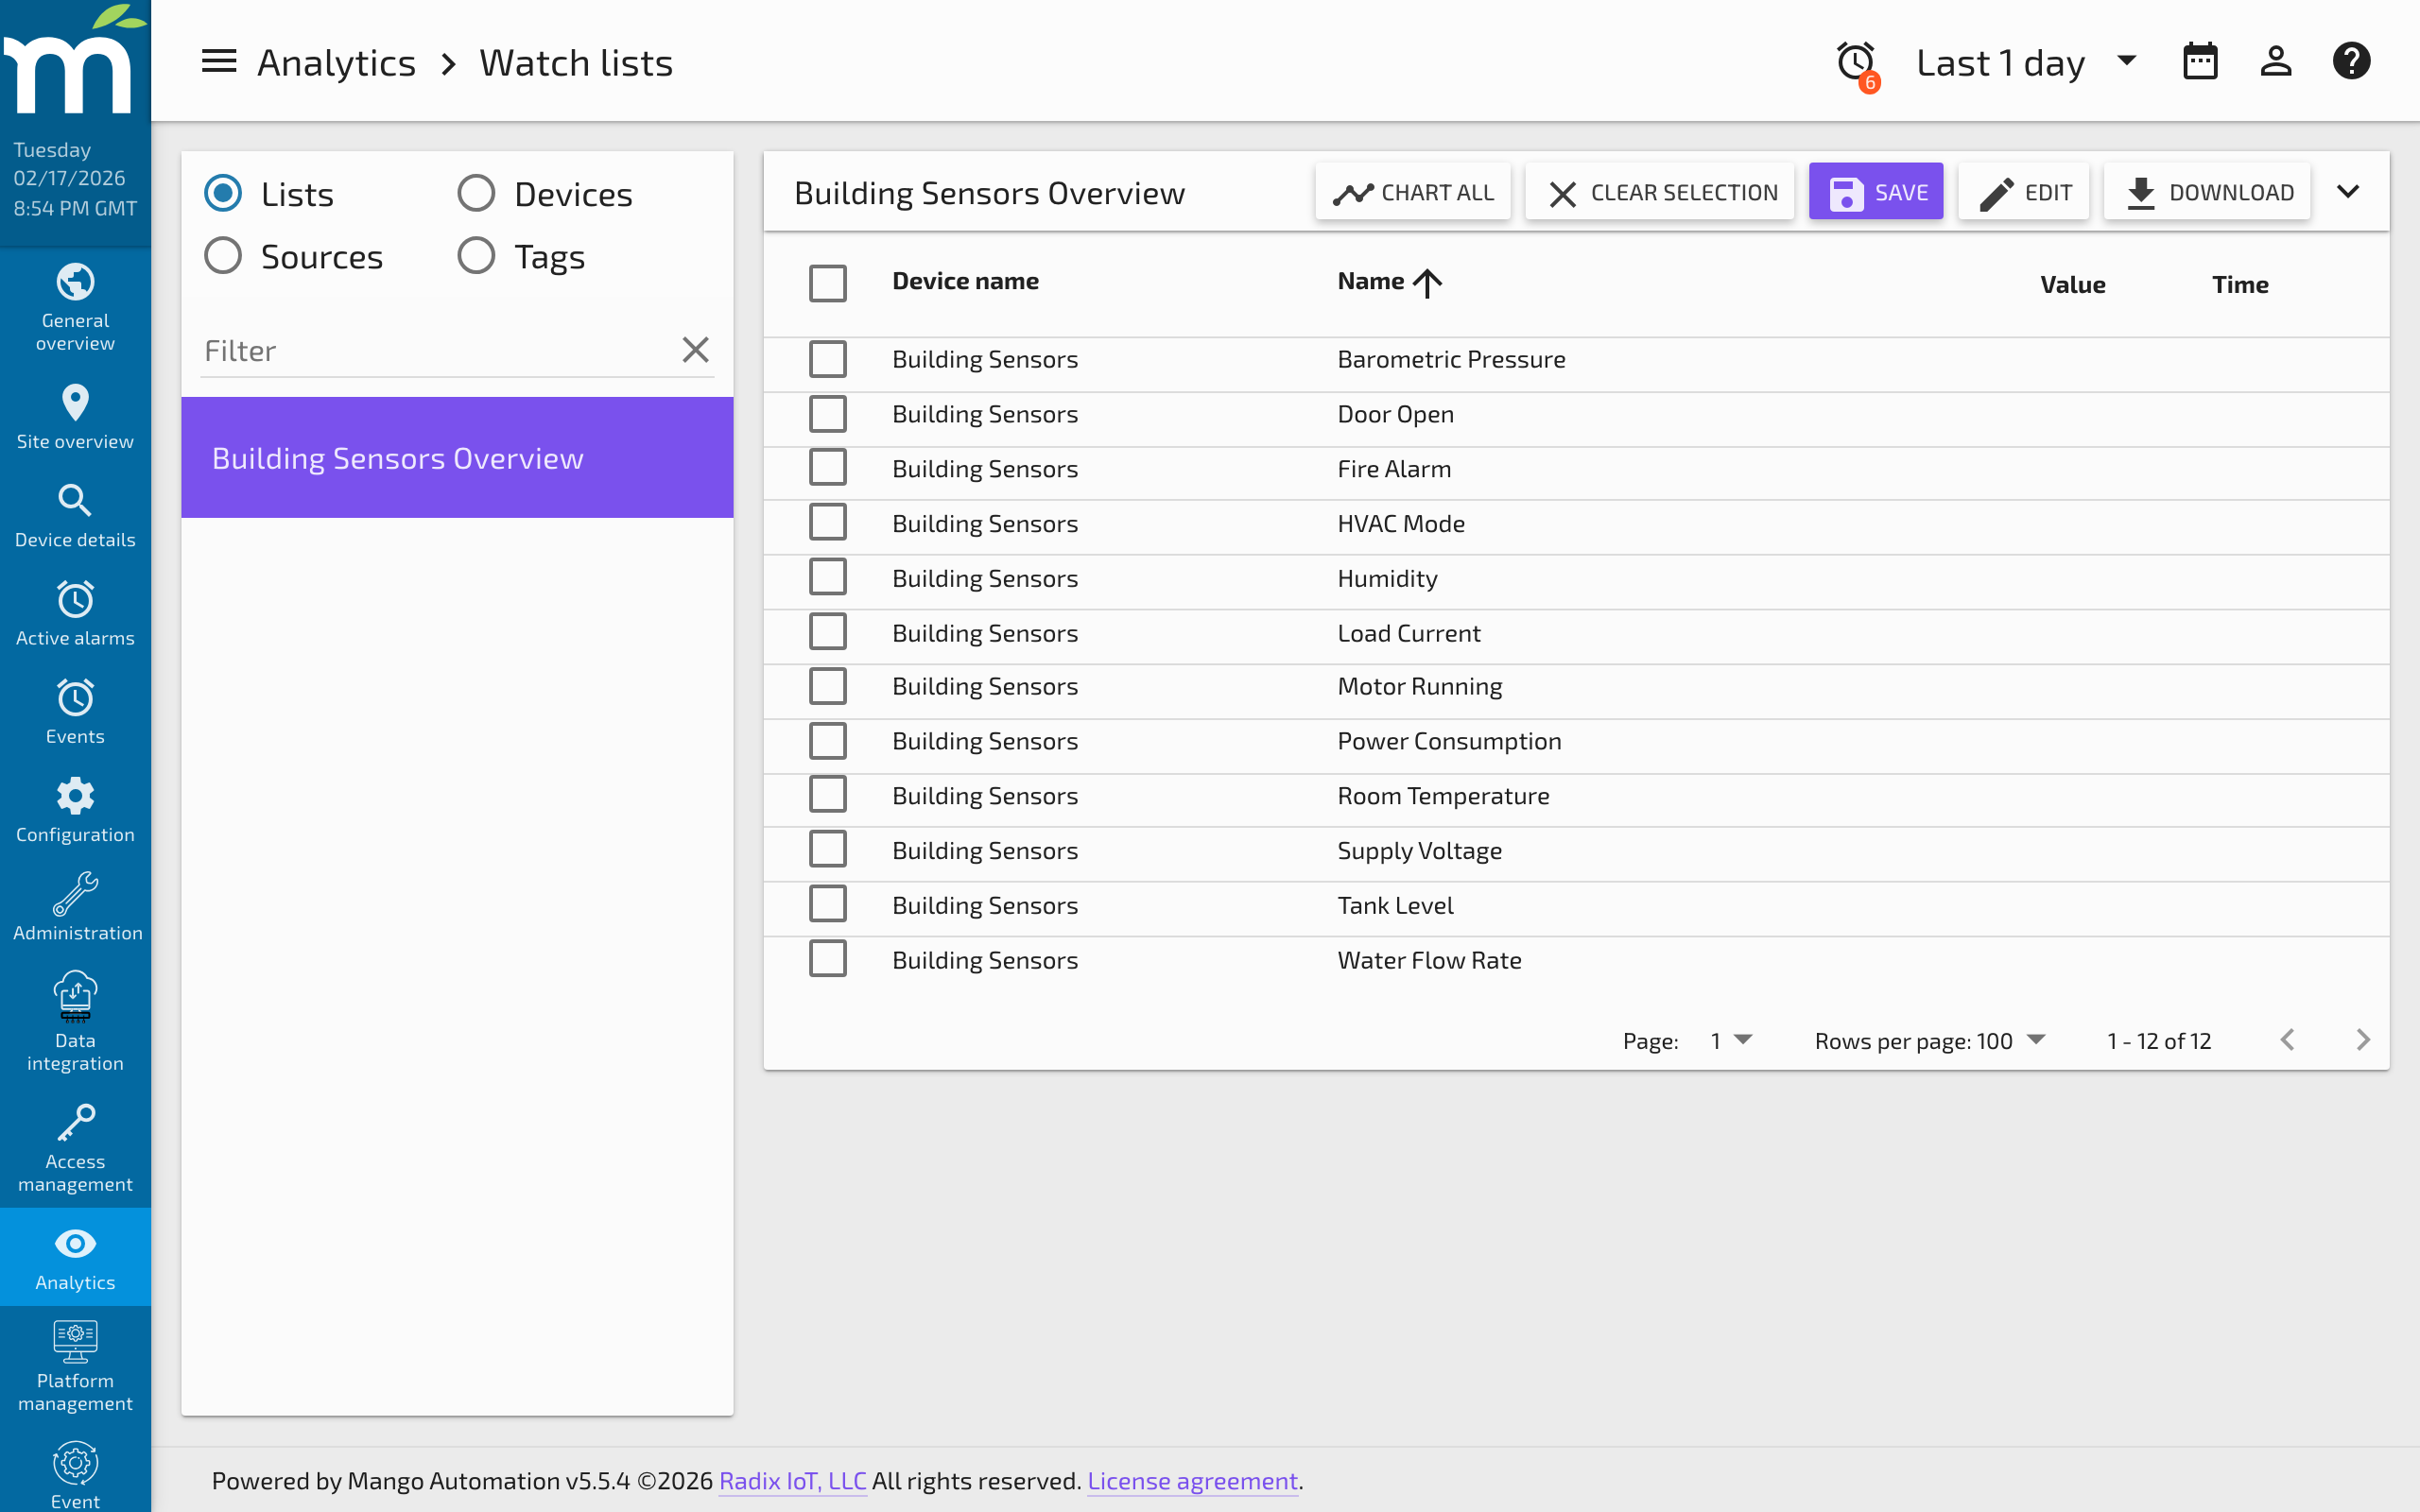
Watch List Table
The watch list table displays one row per data point with the following columns:
- Checkbox -- Select a point to add it to the Chart and Compare pane.
- Device name and Point name -- Identify the data point.
- Value -- The current live value. Values flash as they update in real time.
- Time -- The timestamp of the most recent value.
- Additional columns may appear depending on configuration (tags, status, etc.).
All column headers can be clicked to sort the table ascending or descending by that field.
If the viewed list is a List Type Watch List, the edit button opens the Watch List Builder page to modify the configuration.
Downloading Data
Click the Download button to export point value history. The download dialog provides the following options:
- Download data for checked points only -- Exports data for the points currently selected with checkboxes.
- Download data for all points on watch list -- Exports data for every point in the current watch list.
- Rollup type -- Apply a rollup (average, minimum, maximum, sum, etc.) to the exported data. This reduces the number of rows by aggregating values over time intervals.
- Format -- Choose between CSV (comma-separated values) and JSON formats.
The exported time range is controlled by the date range set in the Header Bar.
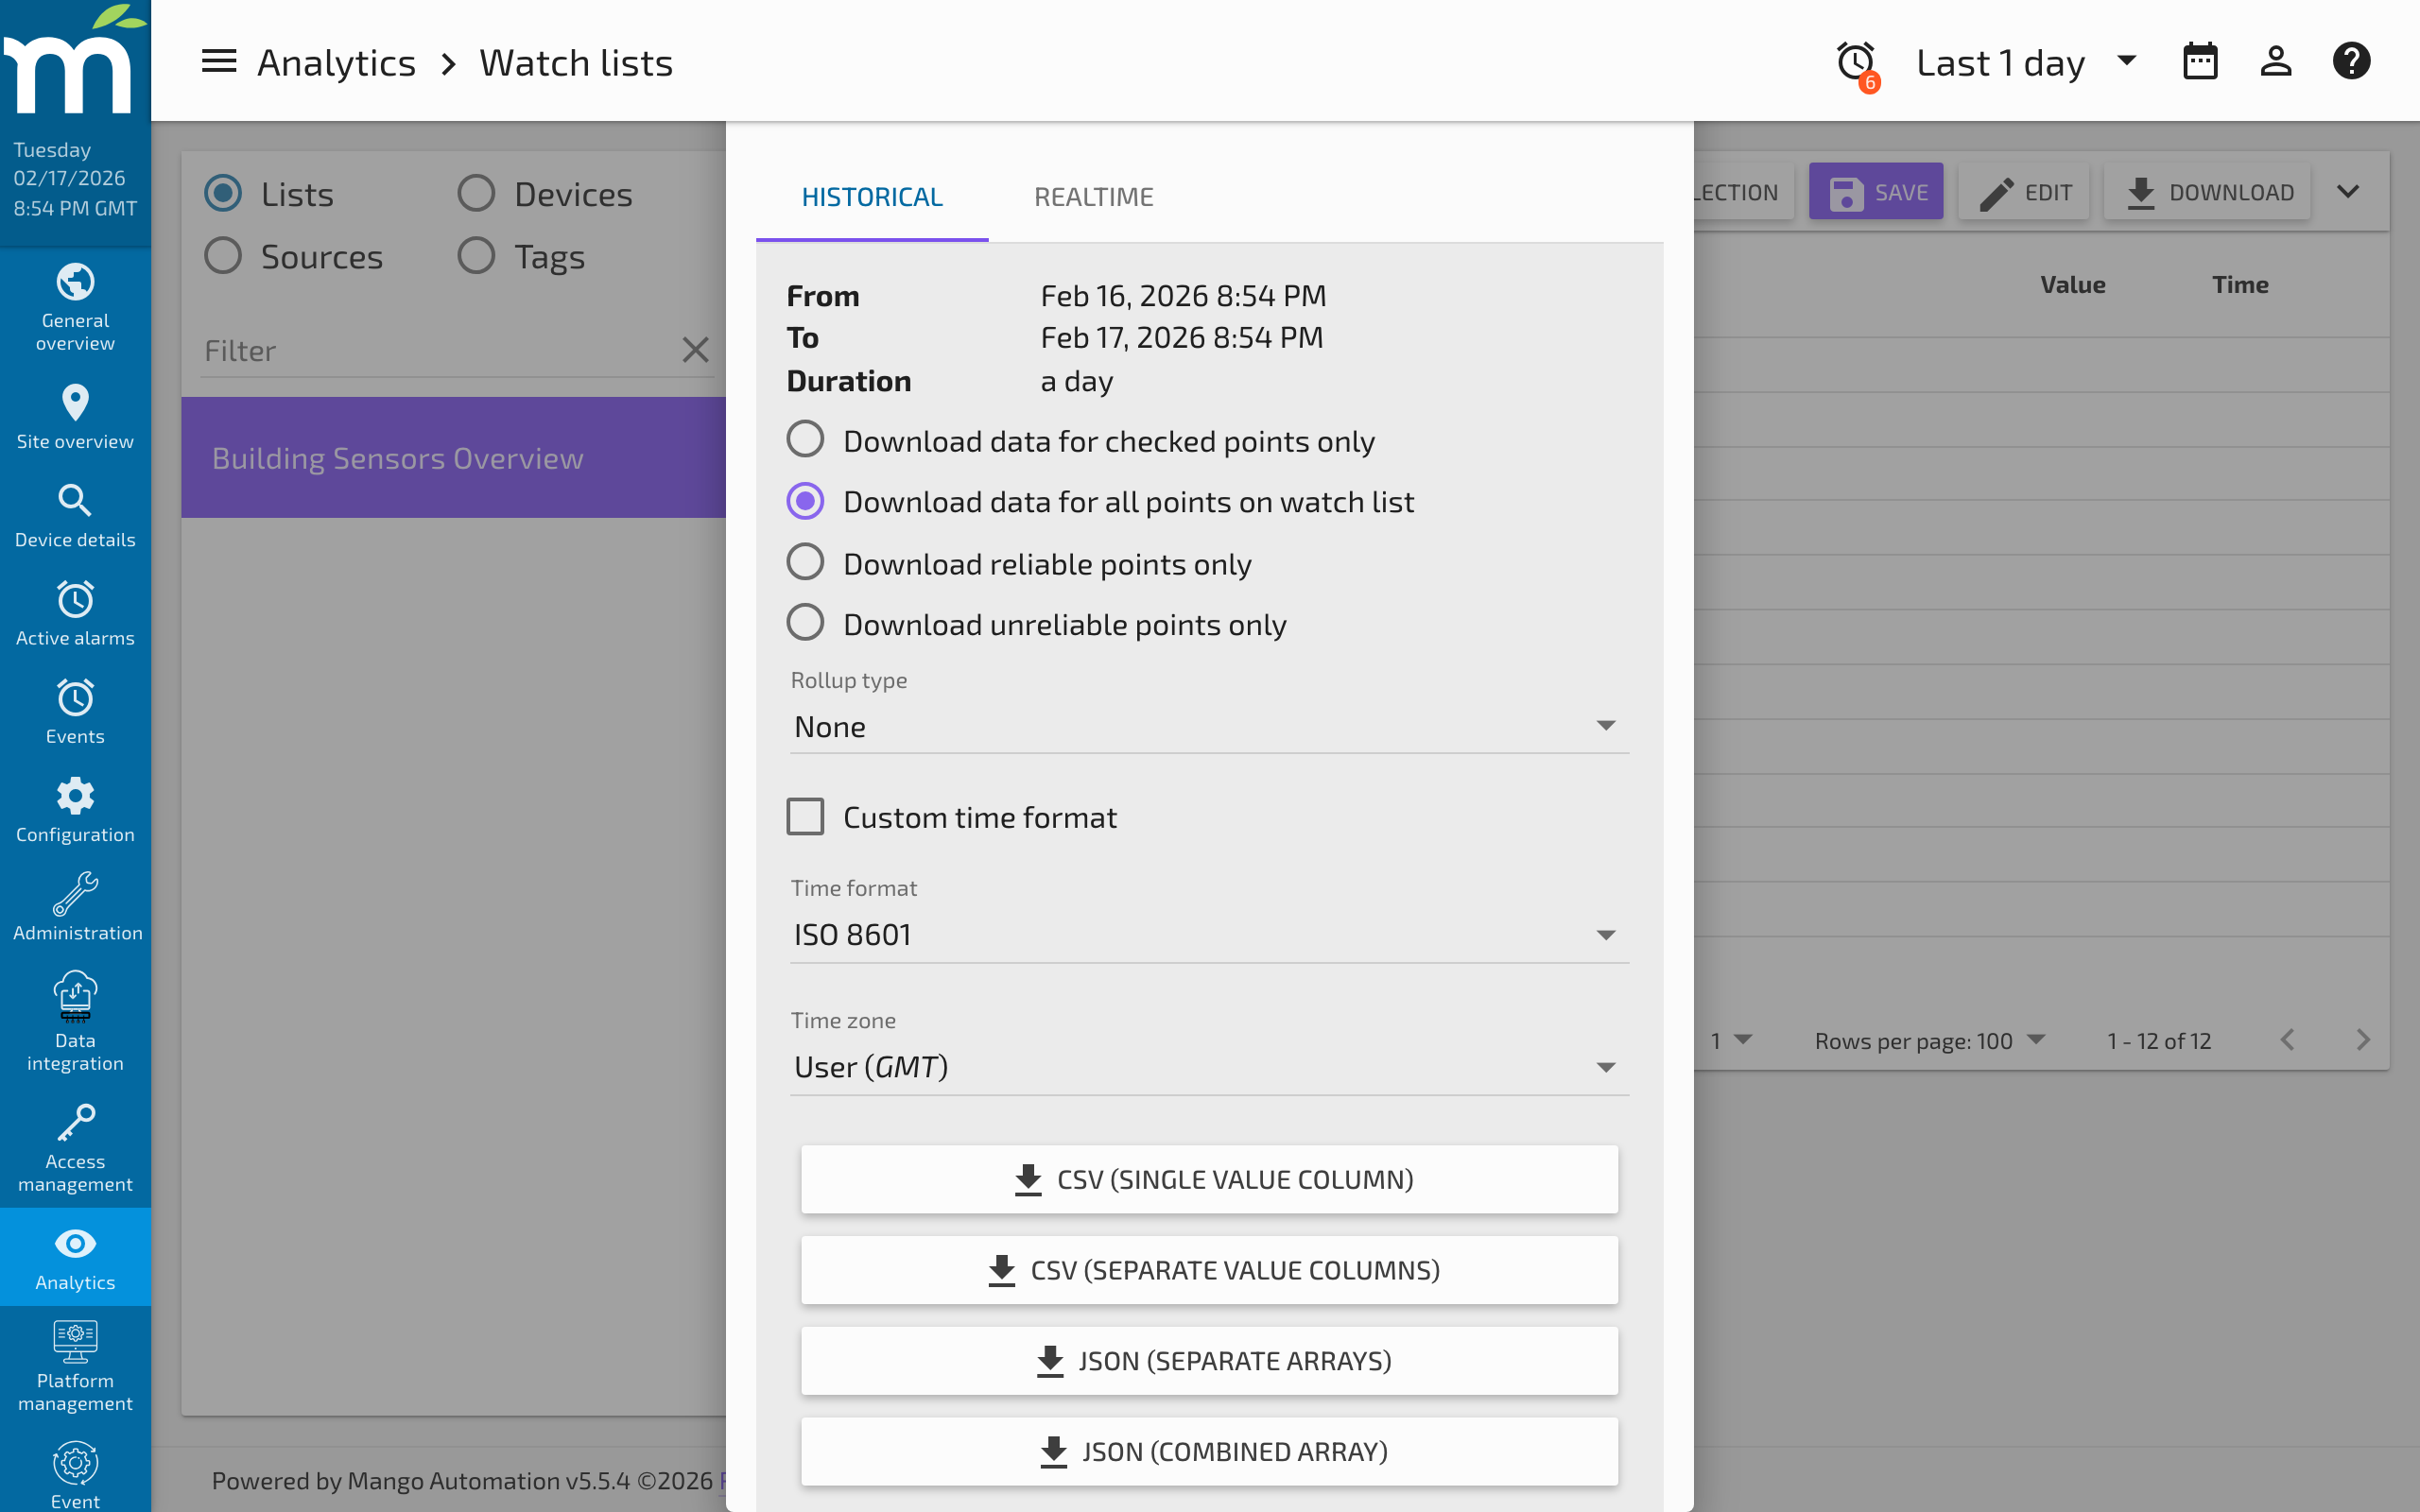
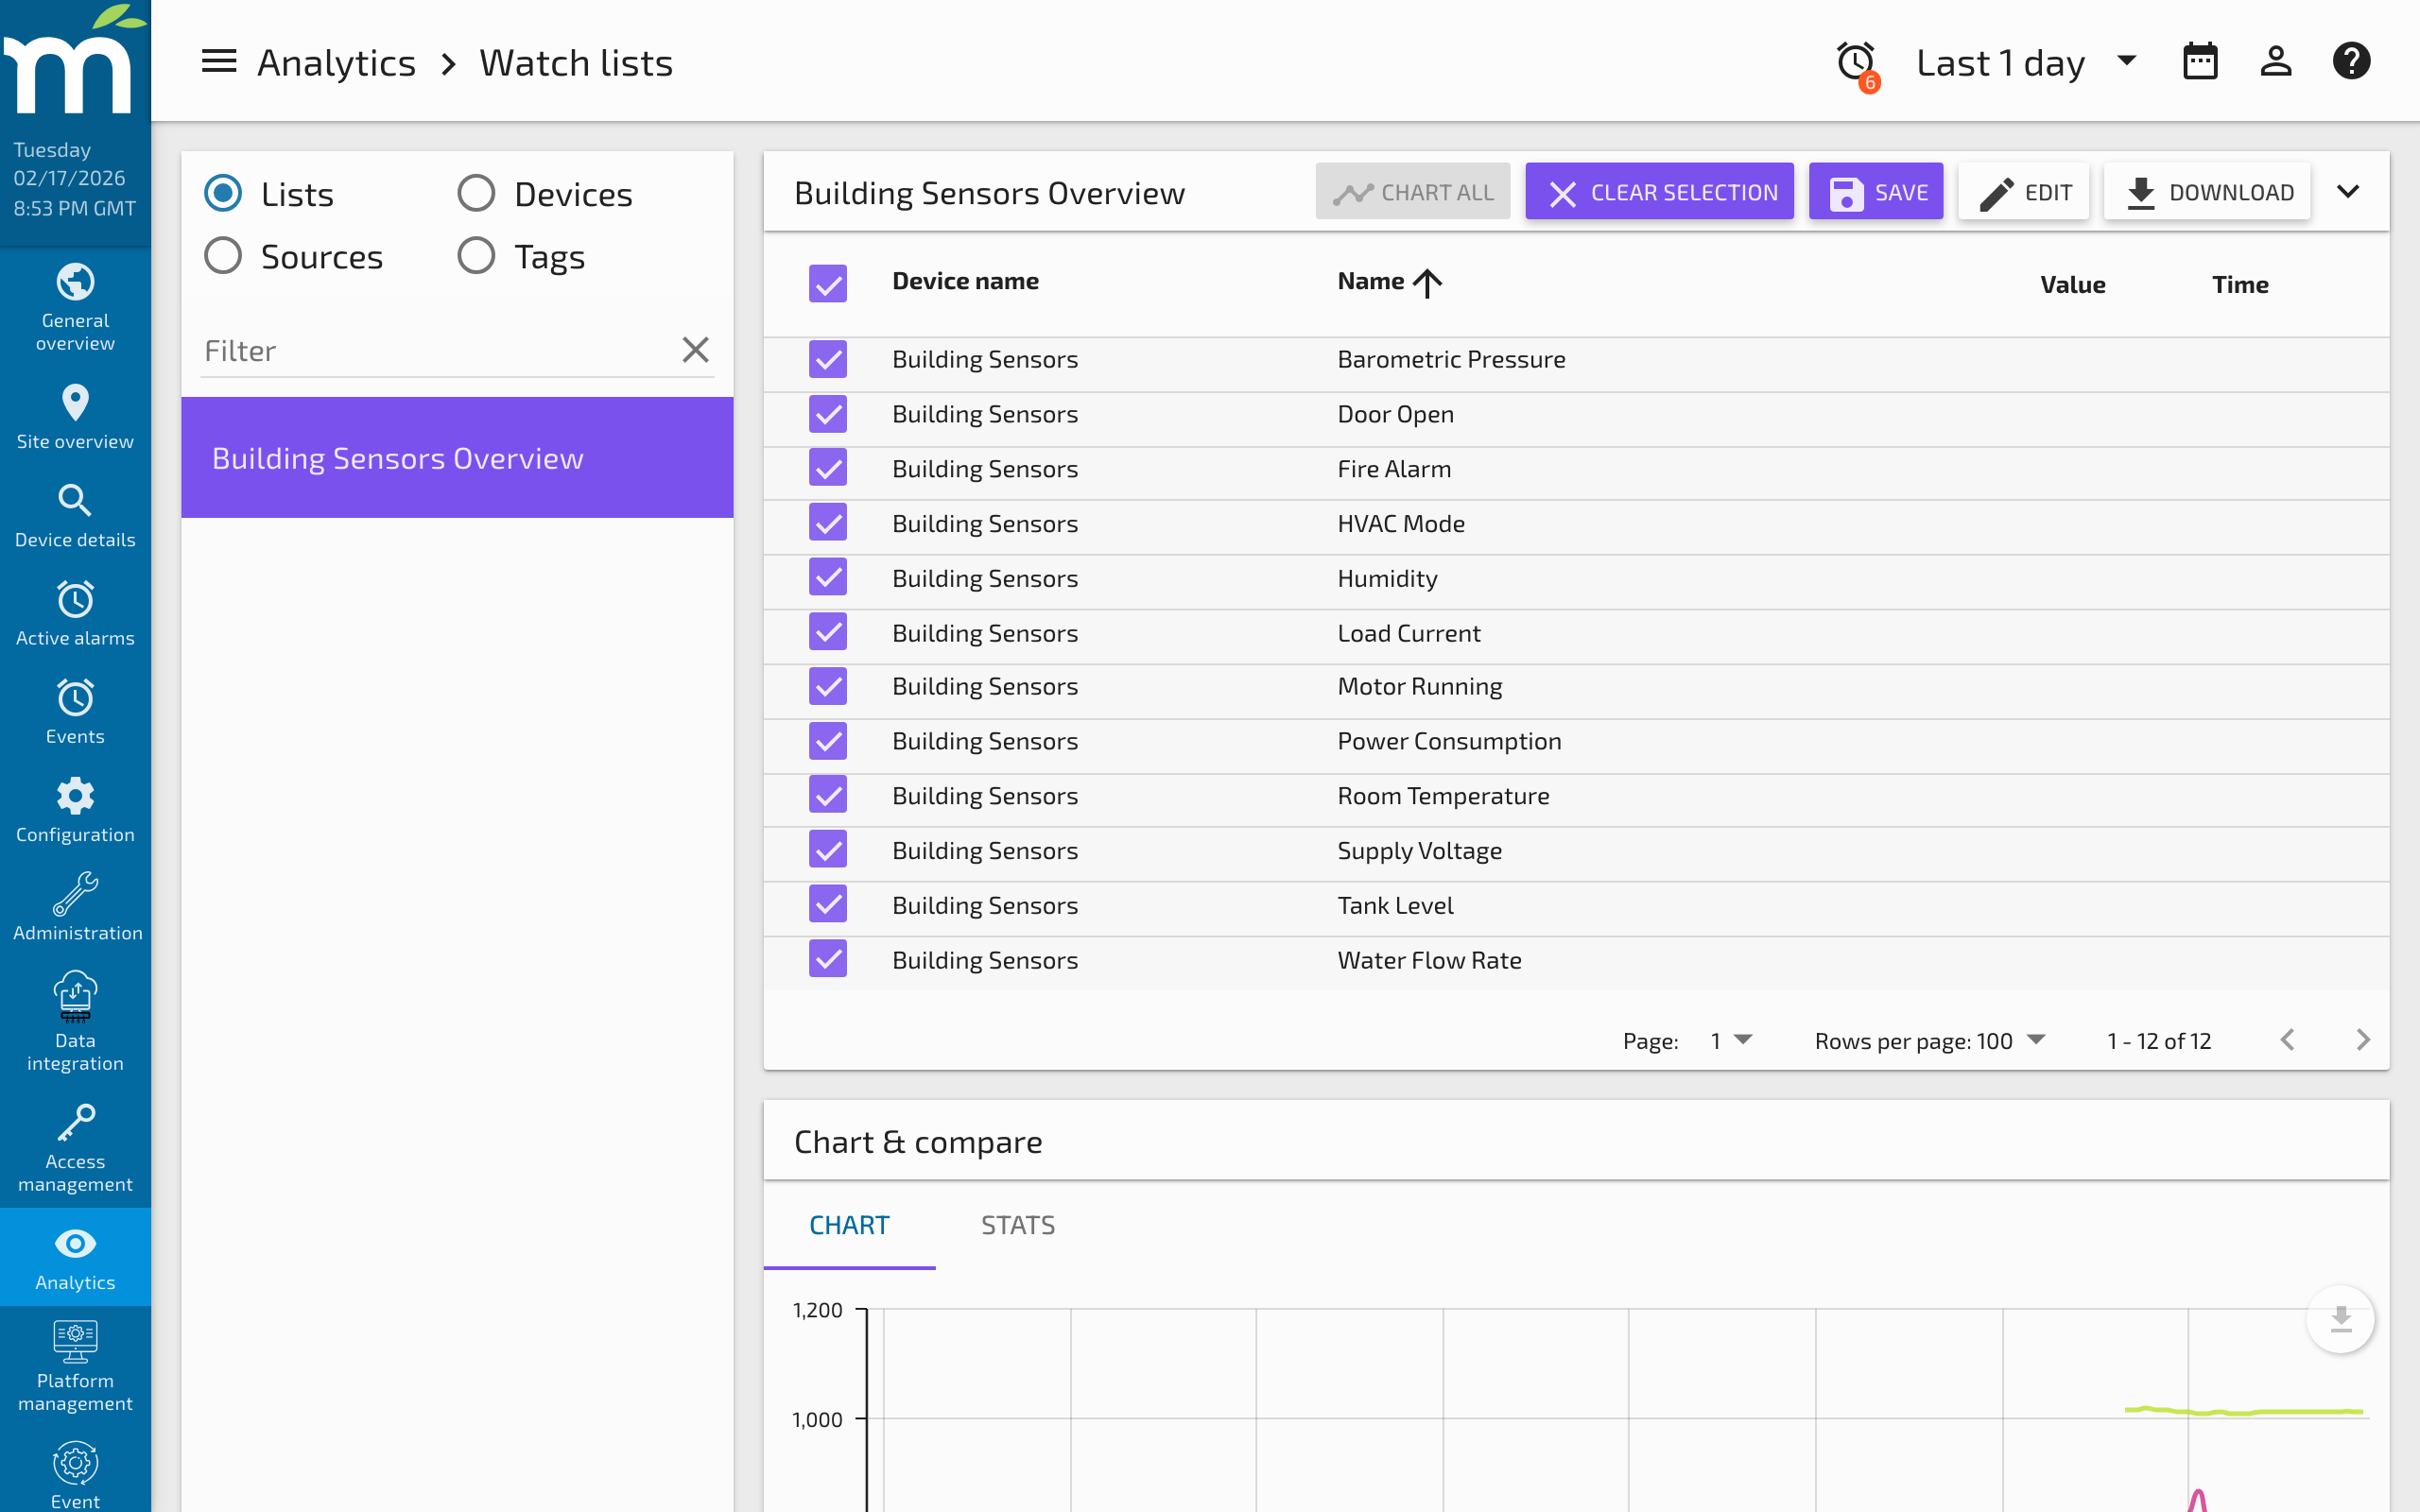
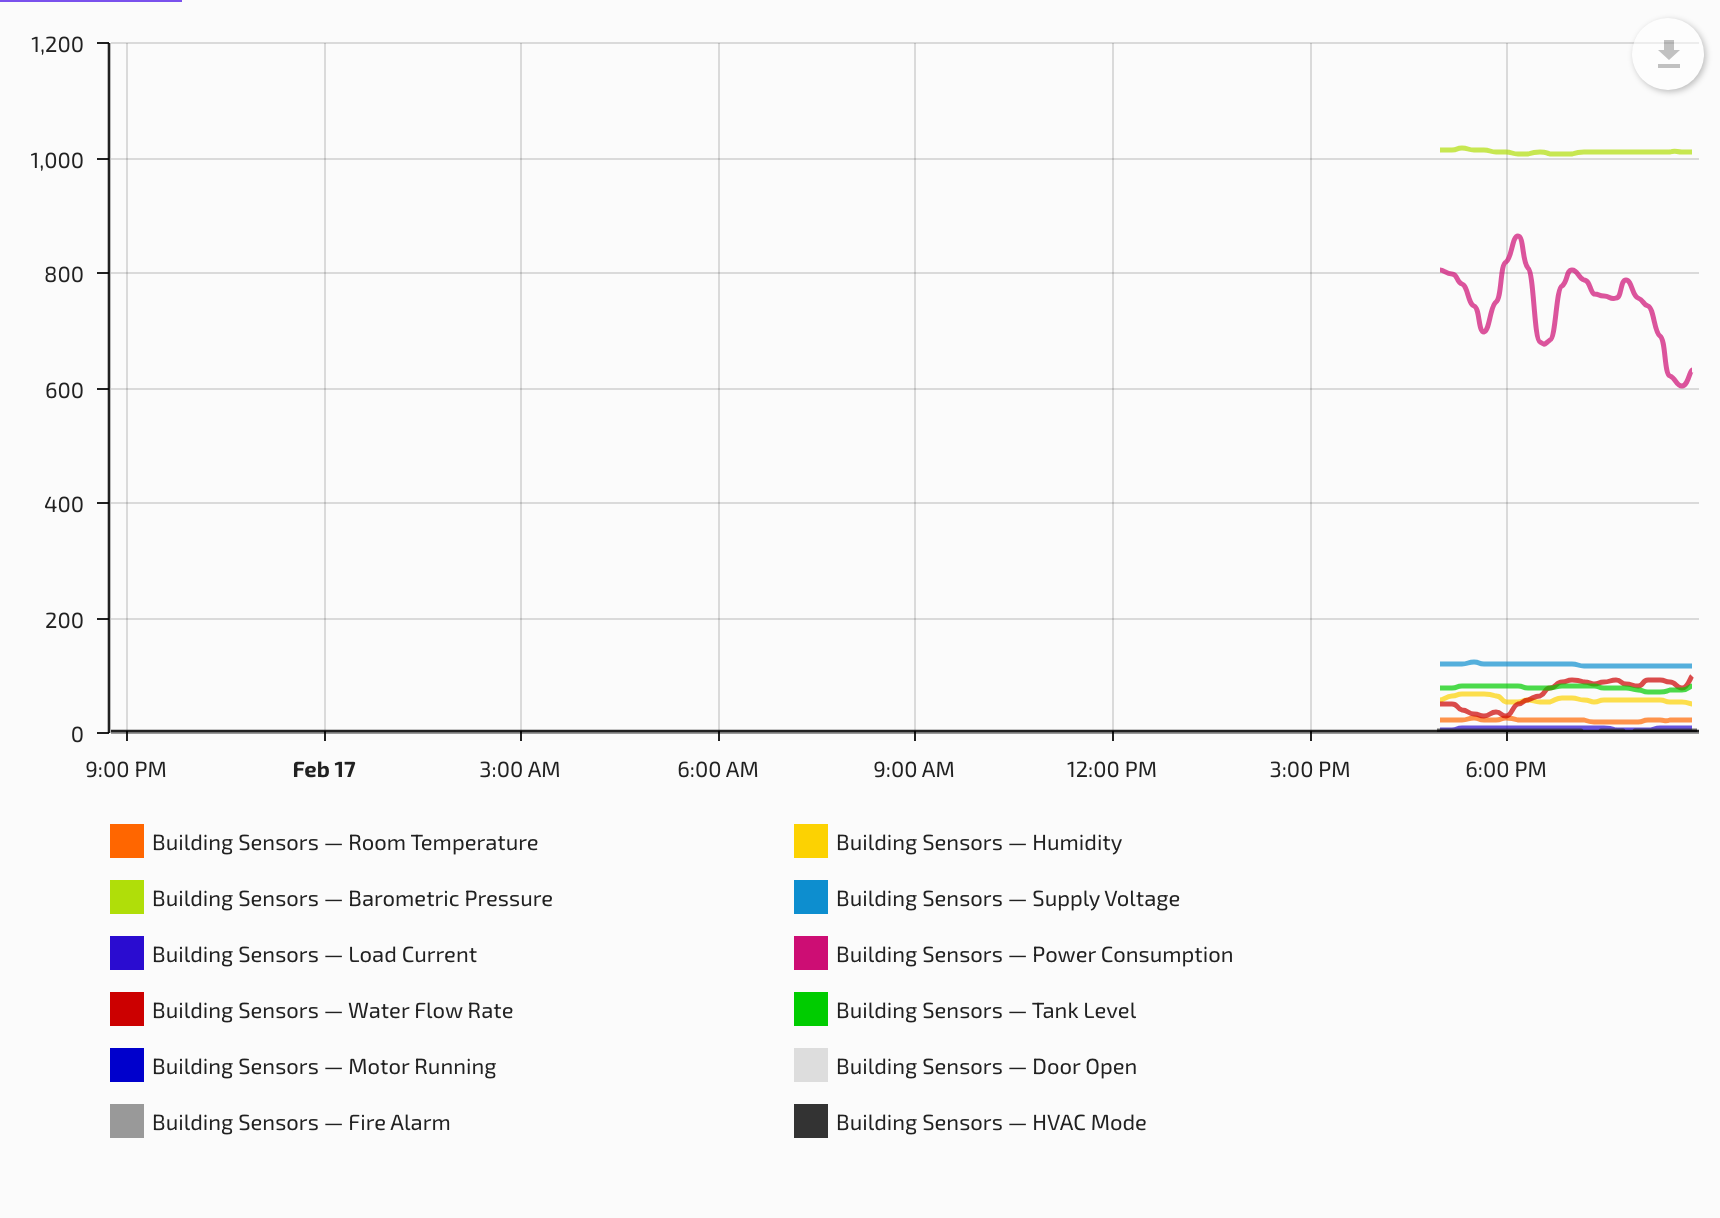
Chart and Compare
The Chart and Compare pane provides a time-series chart for visually comparing data points. To add a point to the chart, click the checkbox in the leftmost column of the watch list table.
Date Range
The date range displayed on the chart is controlled by the Header Bar at the top of the page. You can select preset ranges (Last 5 minutes, Last 1 hour, Last 24 hours, etc.) or specify a custom from/to range.
Configuring Point Appearance
By default, each point is added to the chart using the left Y-axis and the line color configured in the point's properties. To customize the appearance:
- Check the Configure next point checkbox below the chart before adding a point.
- Set the Line color, Chart type (Line, Step, Bar, etc.), and Point axis (Left 1, Left 2, Right 1, Right 2).
- Add the point to the chart. It will use the configured settings.
To change settings for points already on the chart, use the Configure all points/series options.
Axis Configuration
Mango charts support up to four Y-axes (two on the left, two on the right). For each axis you can configure:
- Axis color -- The color used for the axis line and labels.
- Stack type -- Controls how multiple series on the same axis are stacked:
- None -- Series are overlaid.
- Stacked -- Series are stacked, showing combined values as filled areas.
- 100% Stacked -- Series are stacked and normalized to show relative proportions.
Splitting data points across axes by their value range (e.g., temperature on the left axis, humidity on the right axis) makes charts much easier to read when comparing different physical quantities.
Statistics Tab
After adding points to the chart, click the Stats tab to view a statistical comparison over the selected time range. The statistics shown depend on the data type (numeric points show average, minimum, maximum, sum, count; binary/multistate points show runtime and state counts).
Saving Chart Configuration
Modifications to which points are checked, chart colors, axis assignments, and chart type settings must be saved by clicking the Save button. Without saving, these settings are lost when navigating away from the page.
Related Pages
- Watch List Builder — Create and configure static, point query, and point hierarchy watch lists
- Watch List Charts — Use charts with parameter-driven watch lists for interactive data visualization
- Adding and Using Tags — Organize data points with tags for dynamic watch list filtering
- Rollups and Statistics — Understand rollup types used for chart aggregation and data downloads