User Interface Overview
Mango's browser-based interface is fully responsive and works on desktop, tablet, and mobile devices. After installation, log in with the default credentials (admin / admin) to reach the home page.
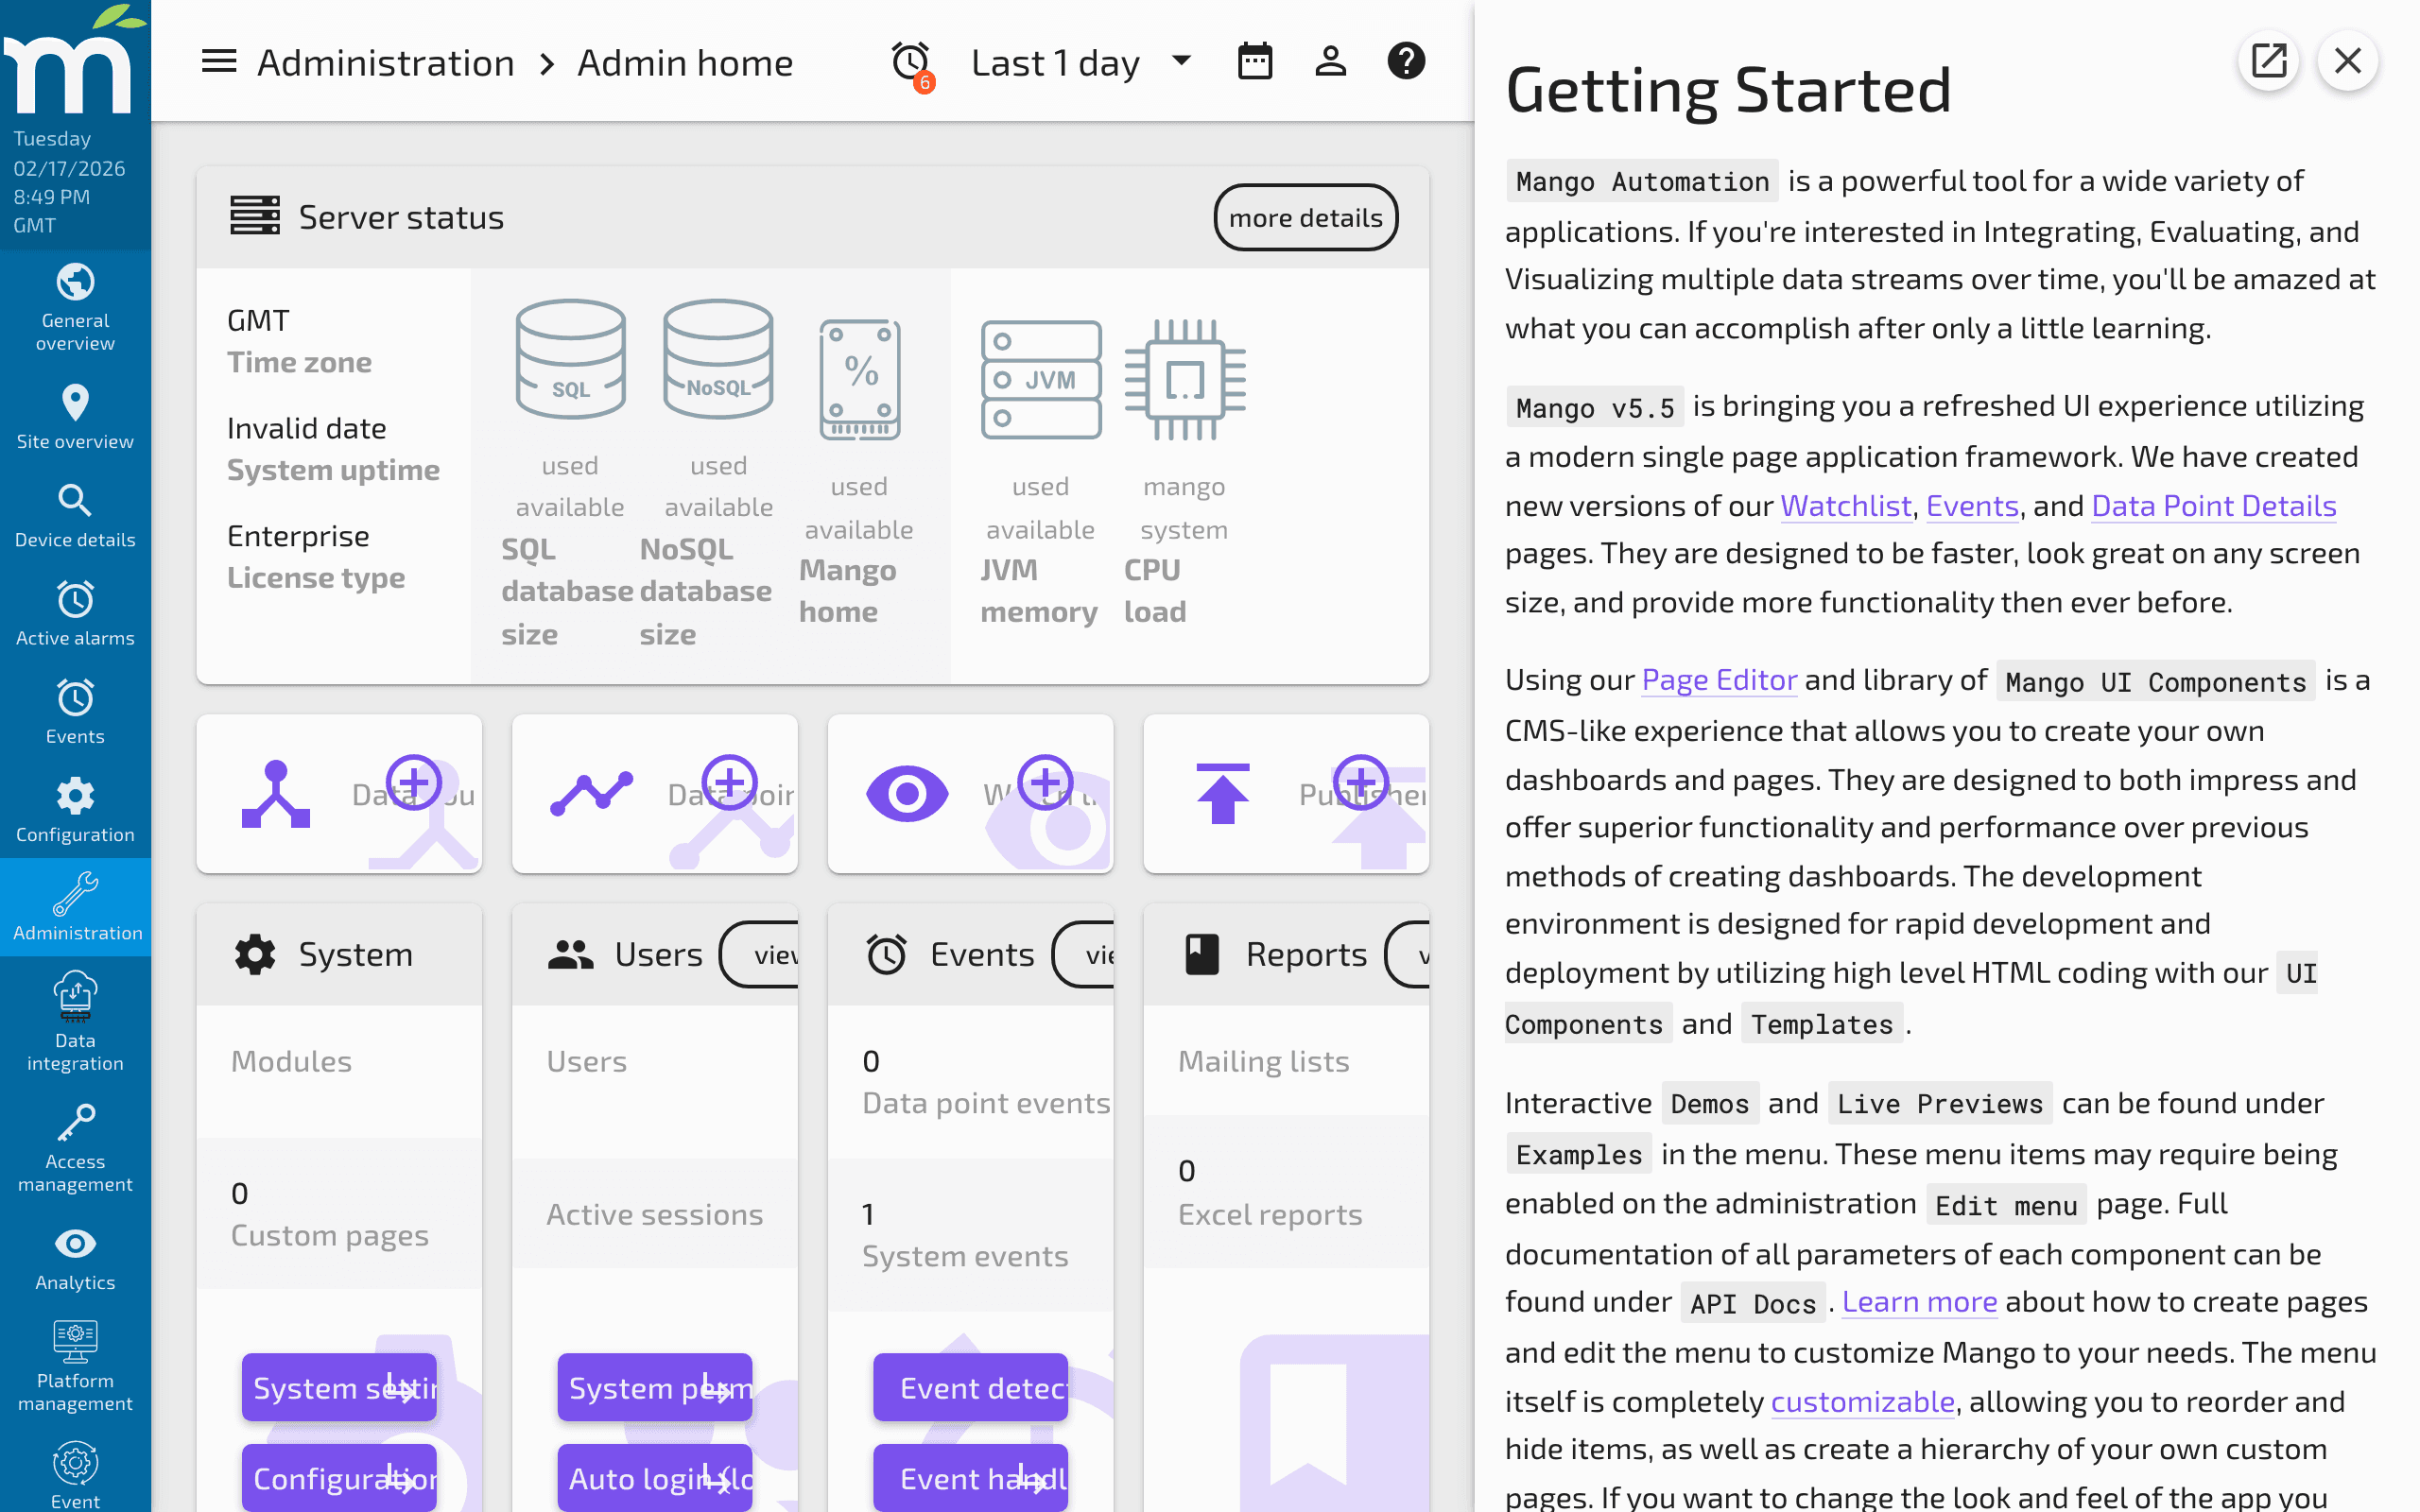
The home page provides quick links to the most useful tools and resources in the Mango system. For administrators, it displays an at-a-glance summary of how your system is configured -- the number of data points, data sources, server status, and more.
You can see how many active sessions are running and quickly navigate to edit your user settings.
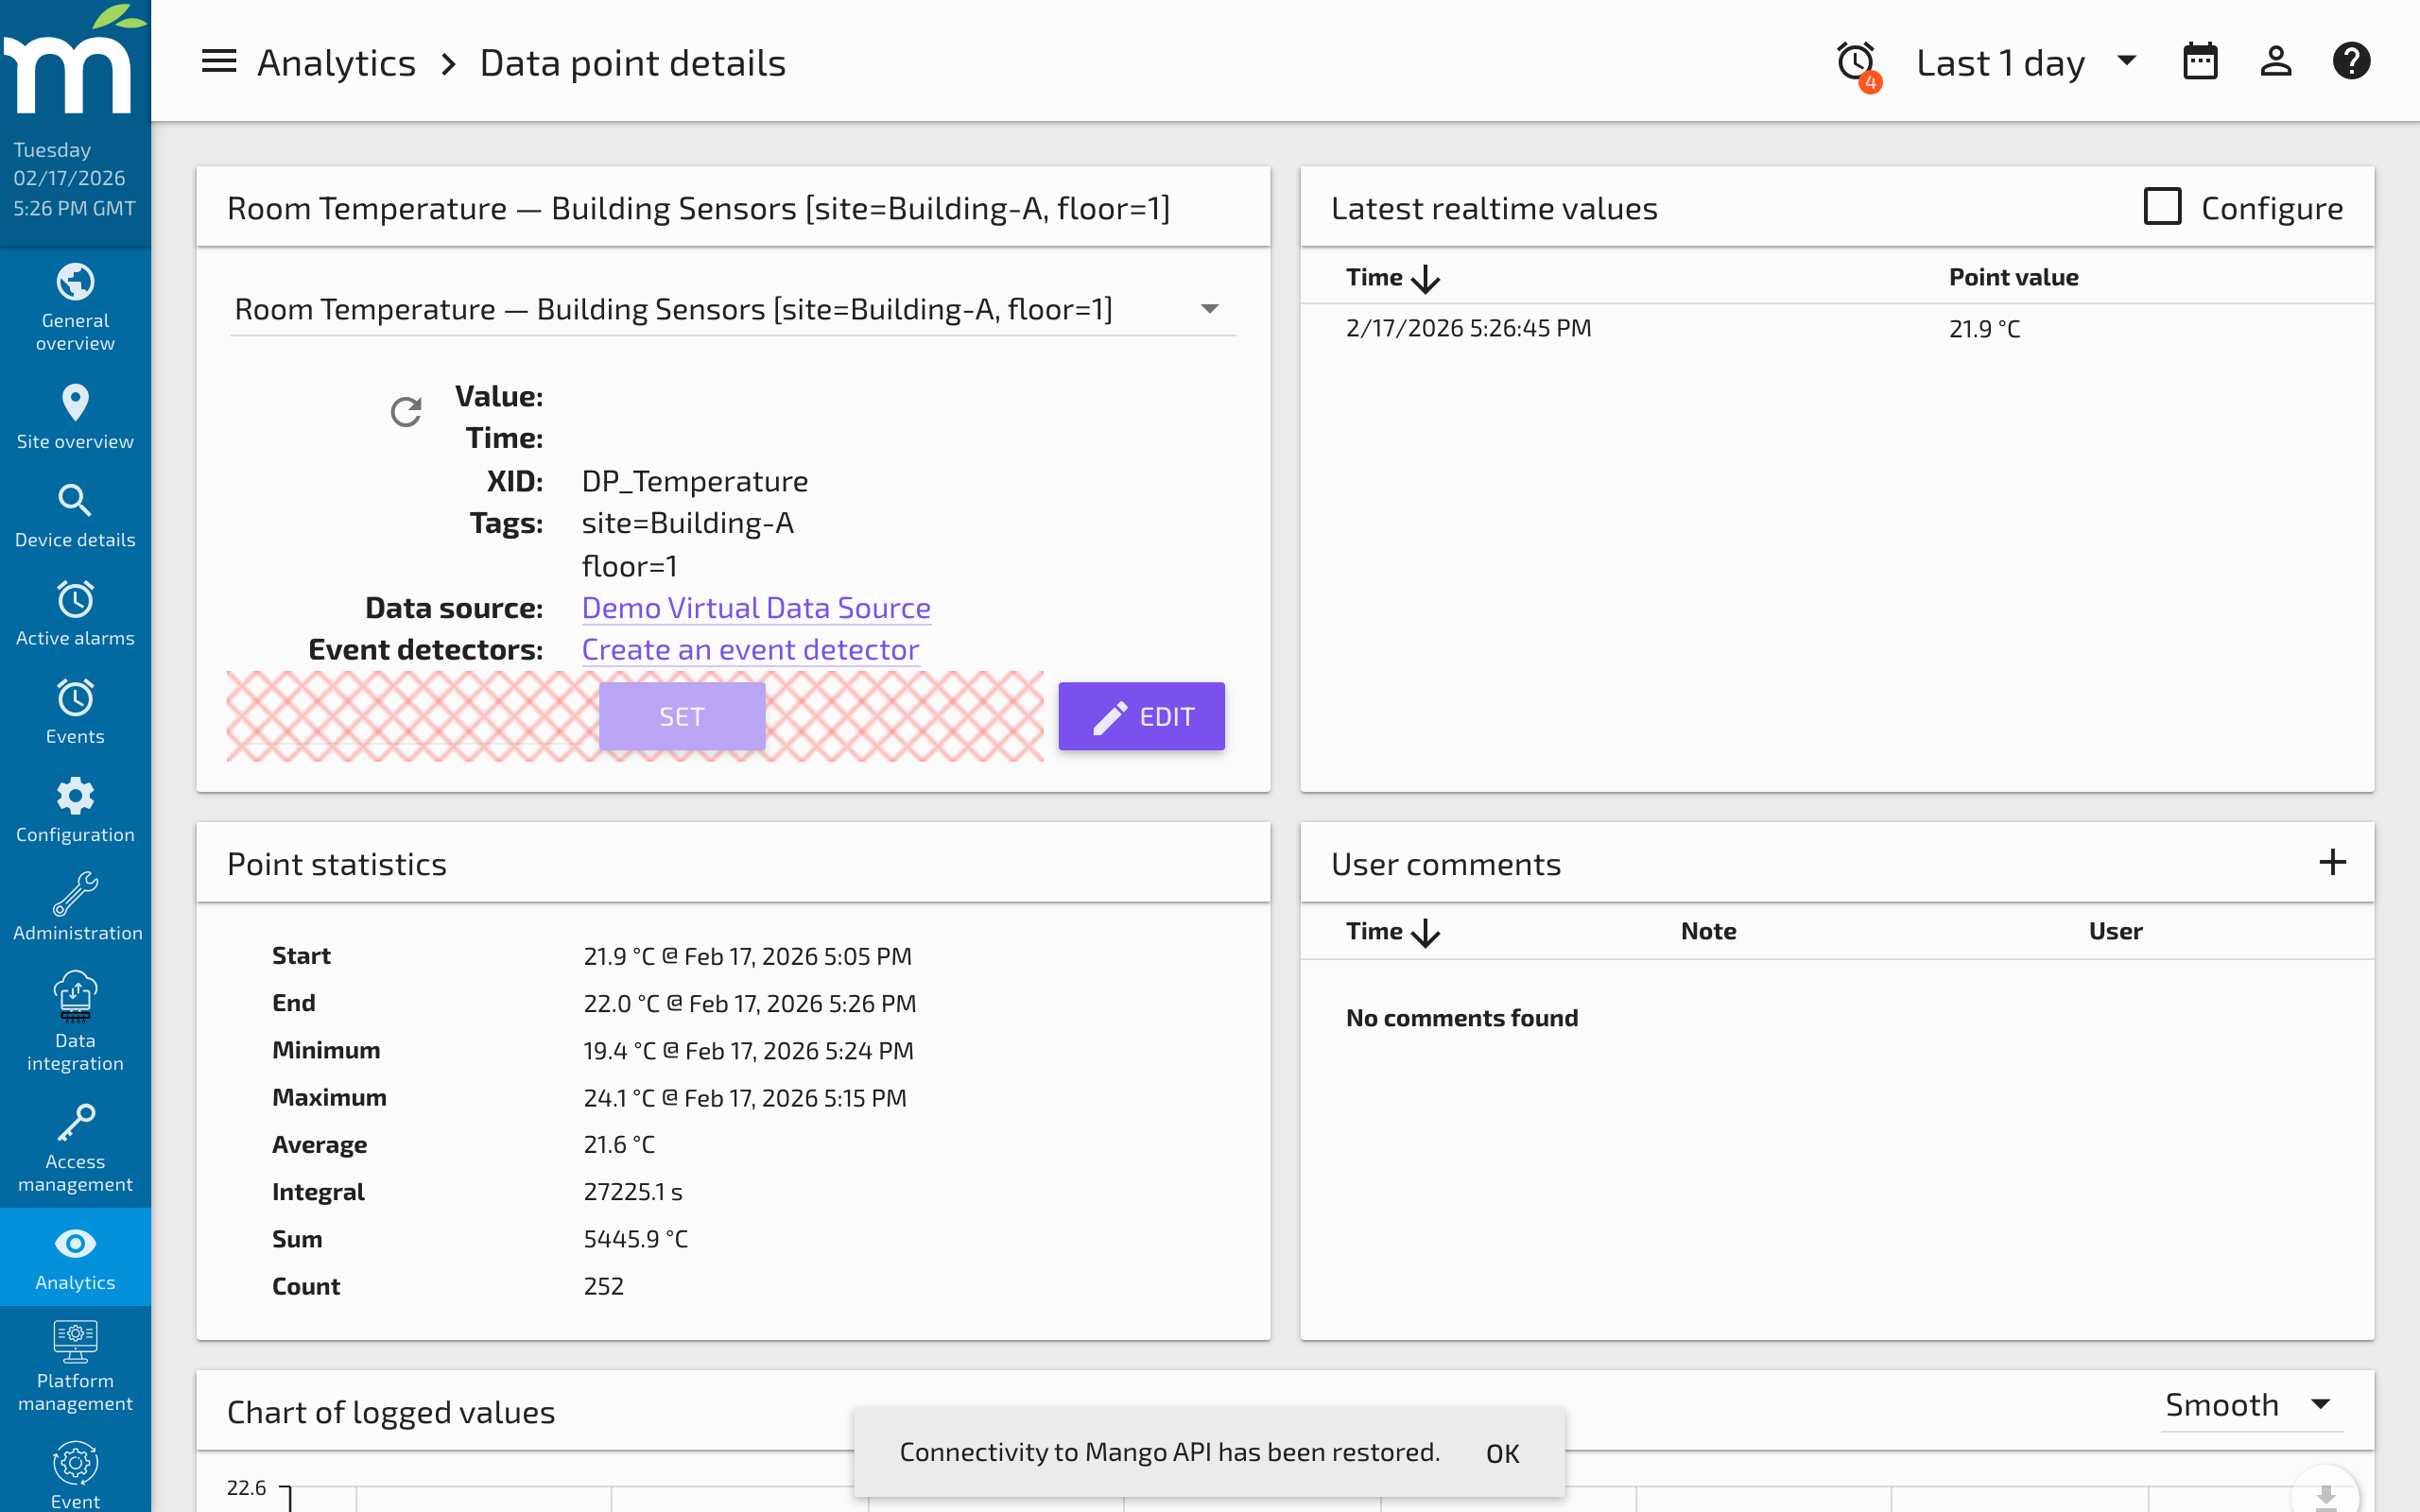
Data Point Details
The Data Point Details view provides detailed analysis of an individual data point, including statistics and history queries.
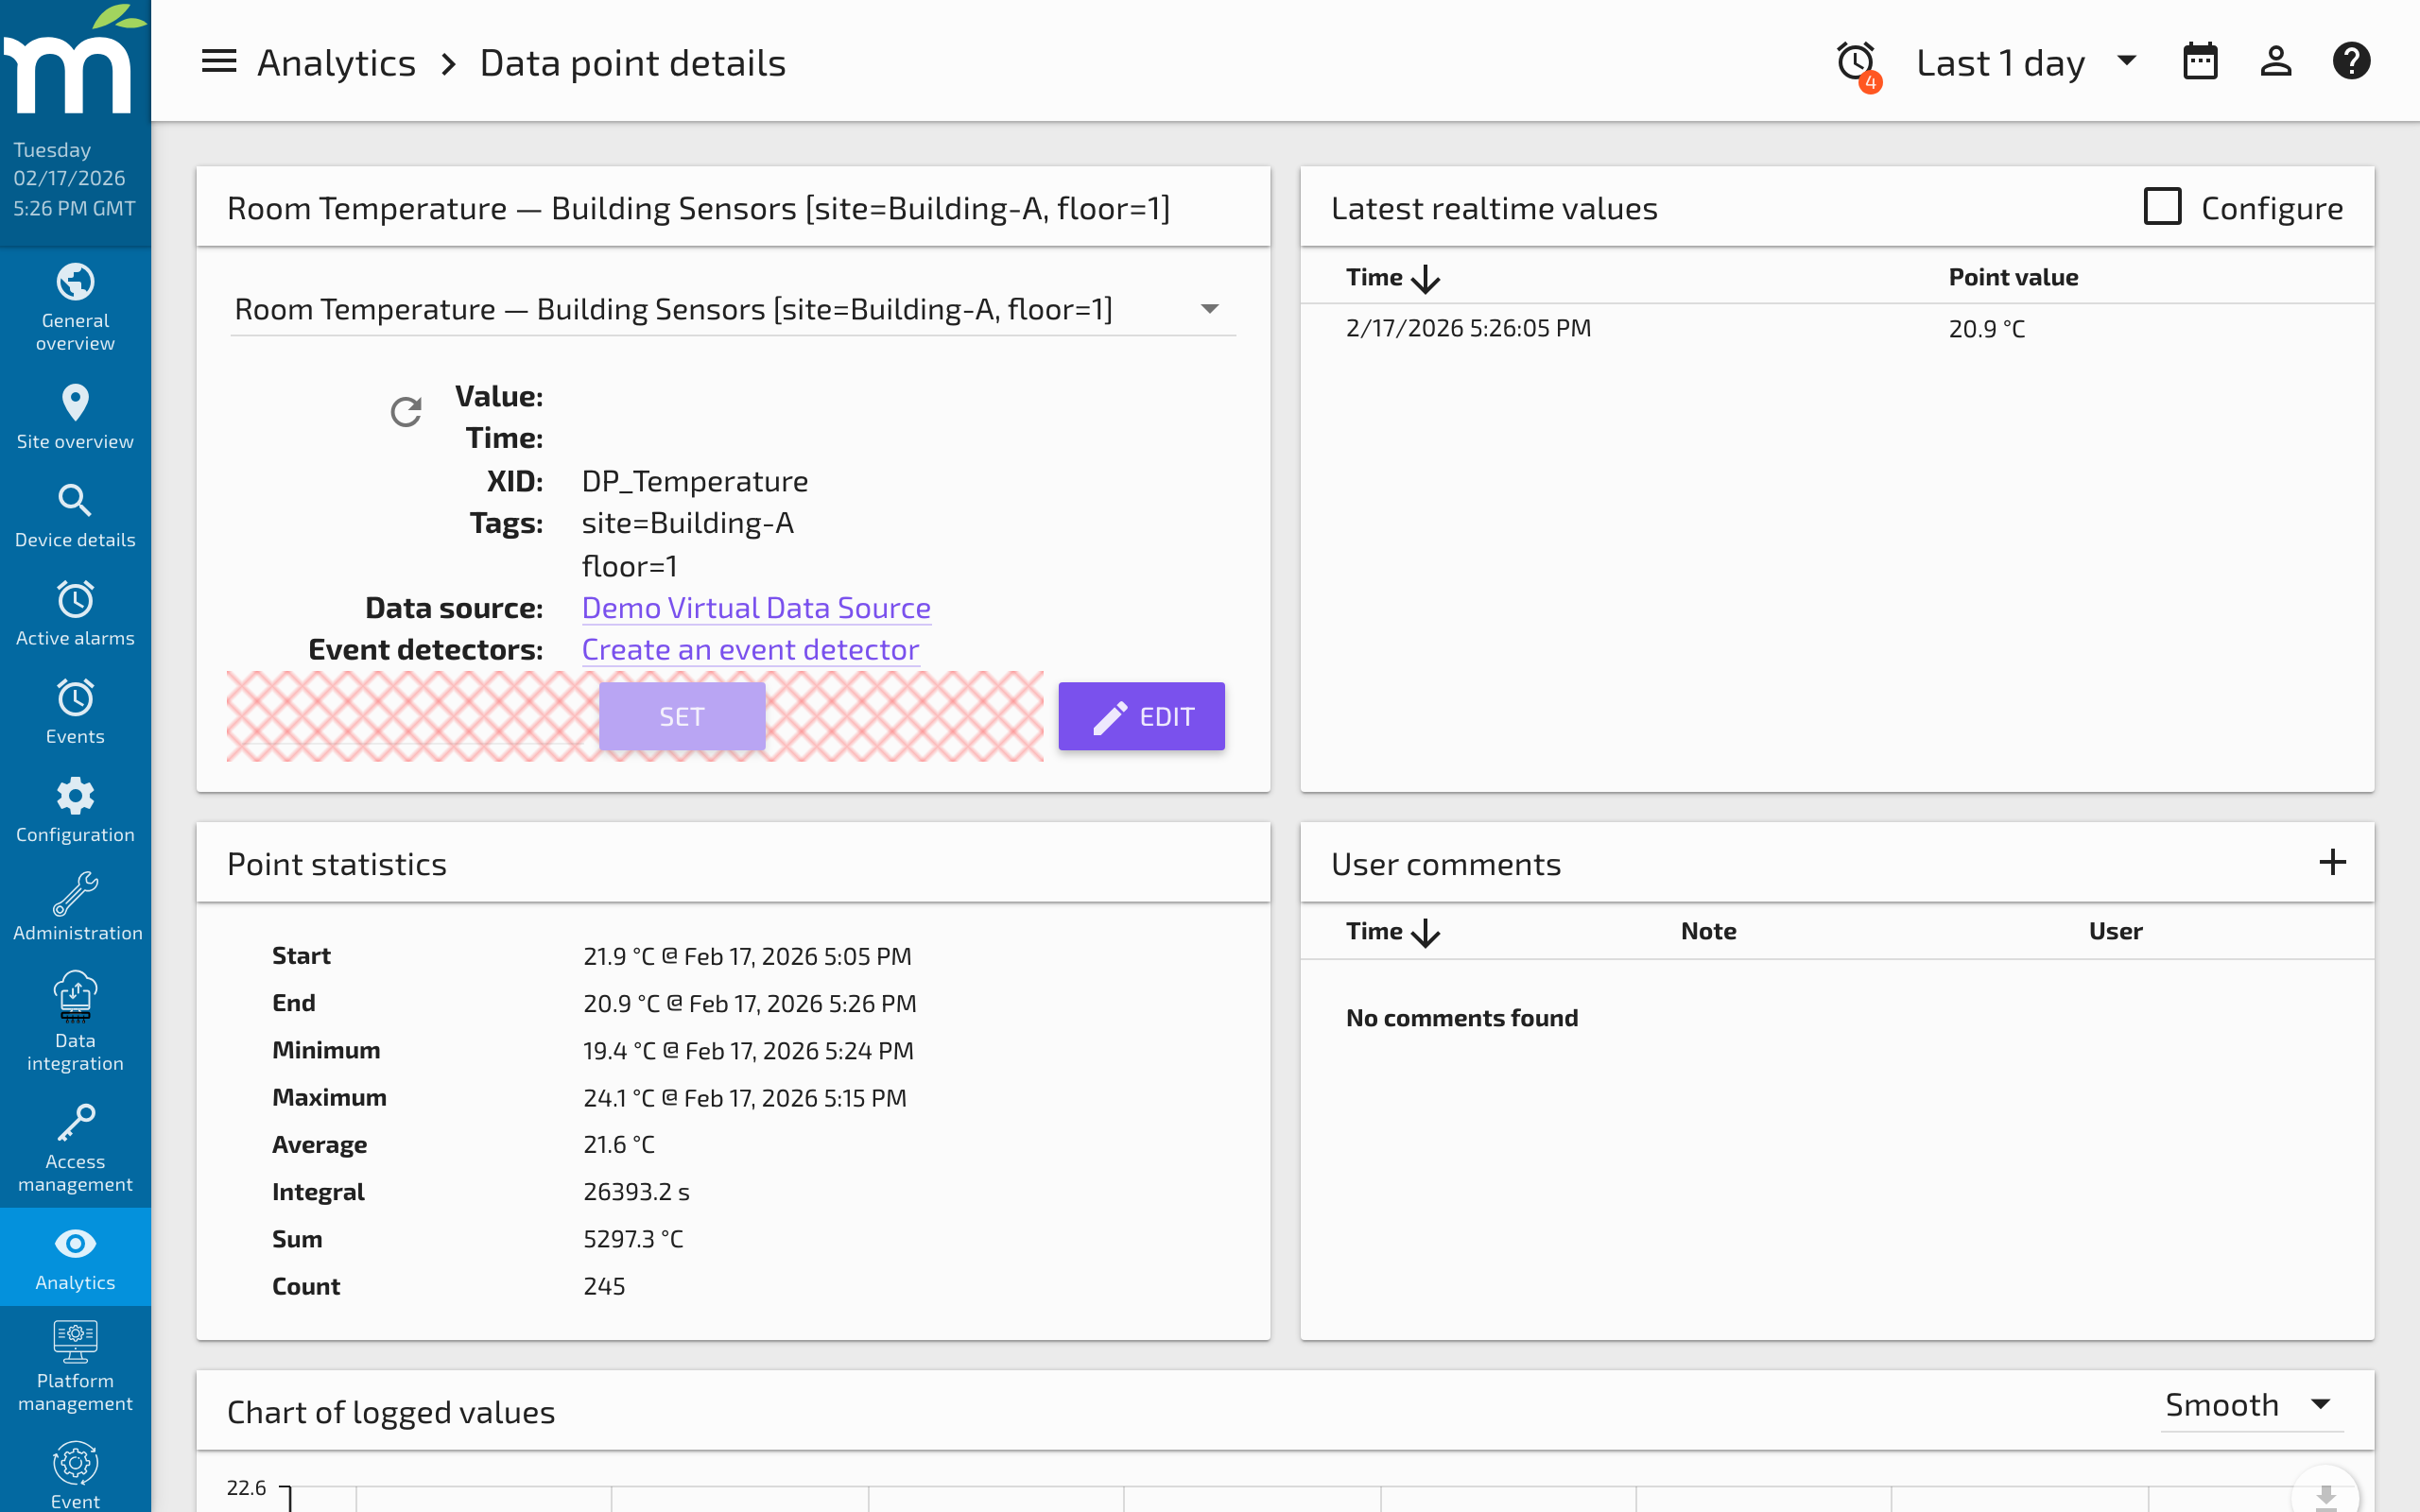
Date and Time Selector
At the top of the page you will find a universal date selector, used throughout the user interface on all pages. The simple selector lets you choose from a basic time range.
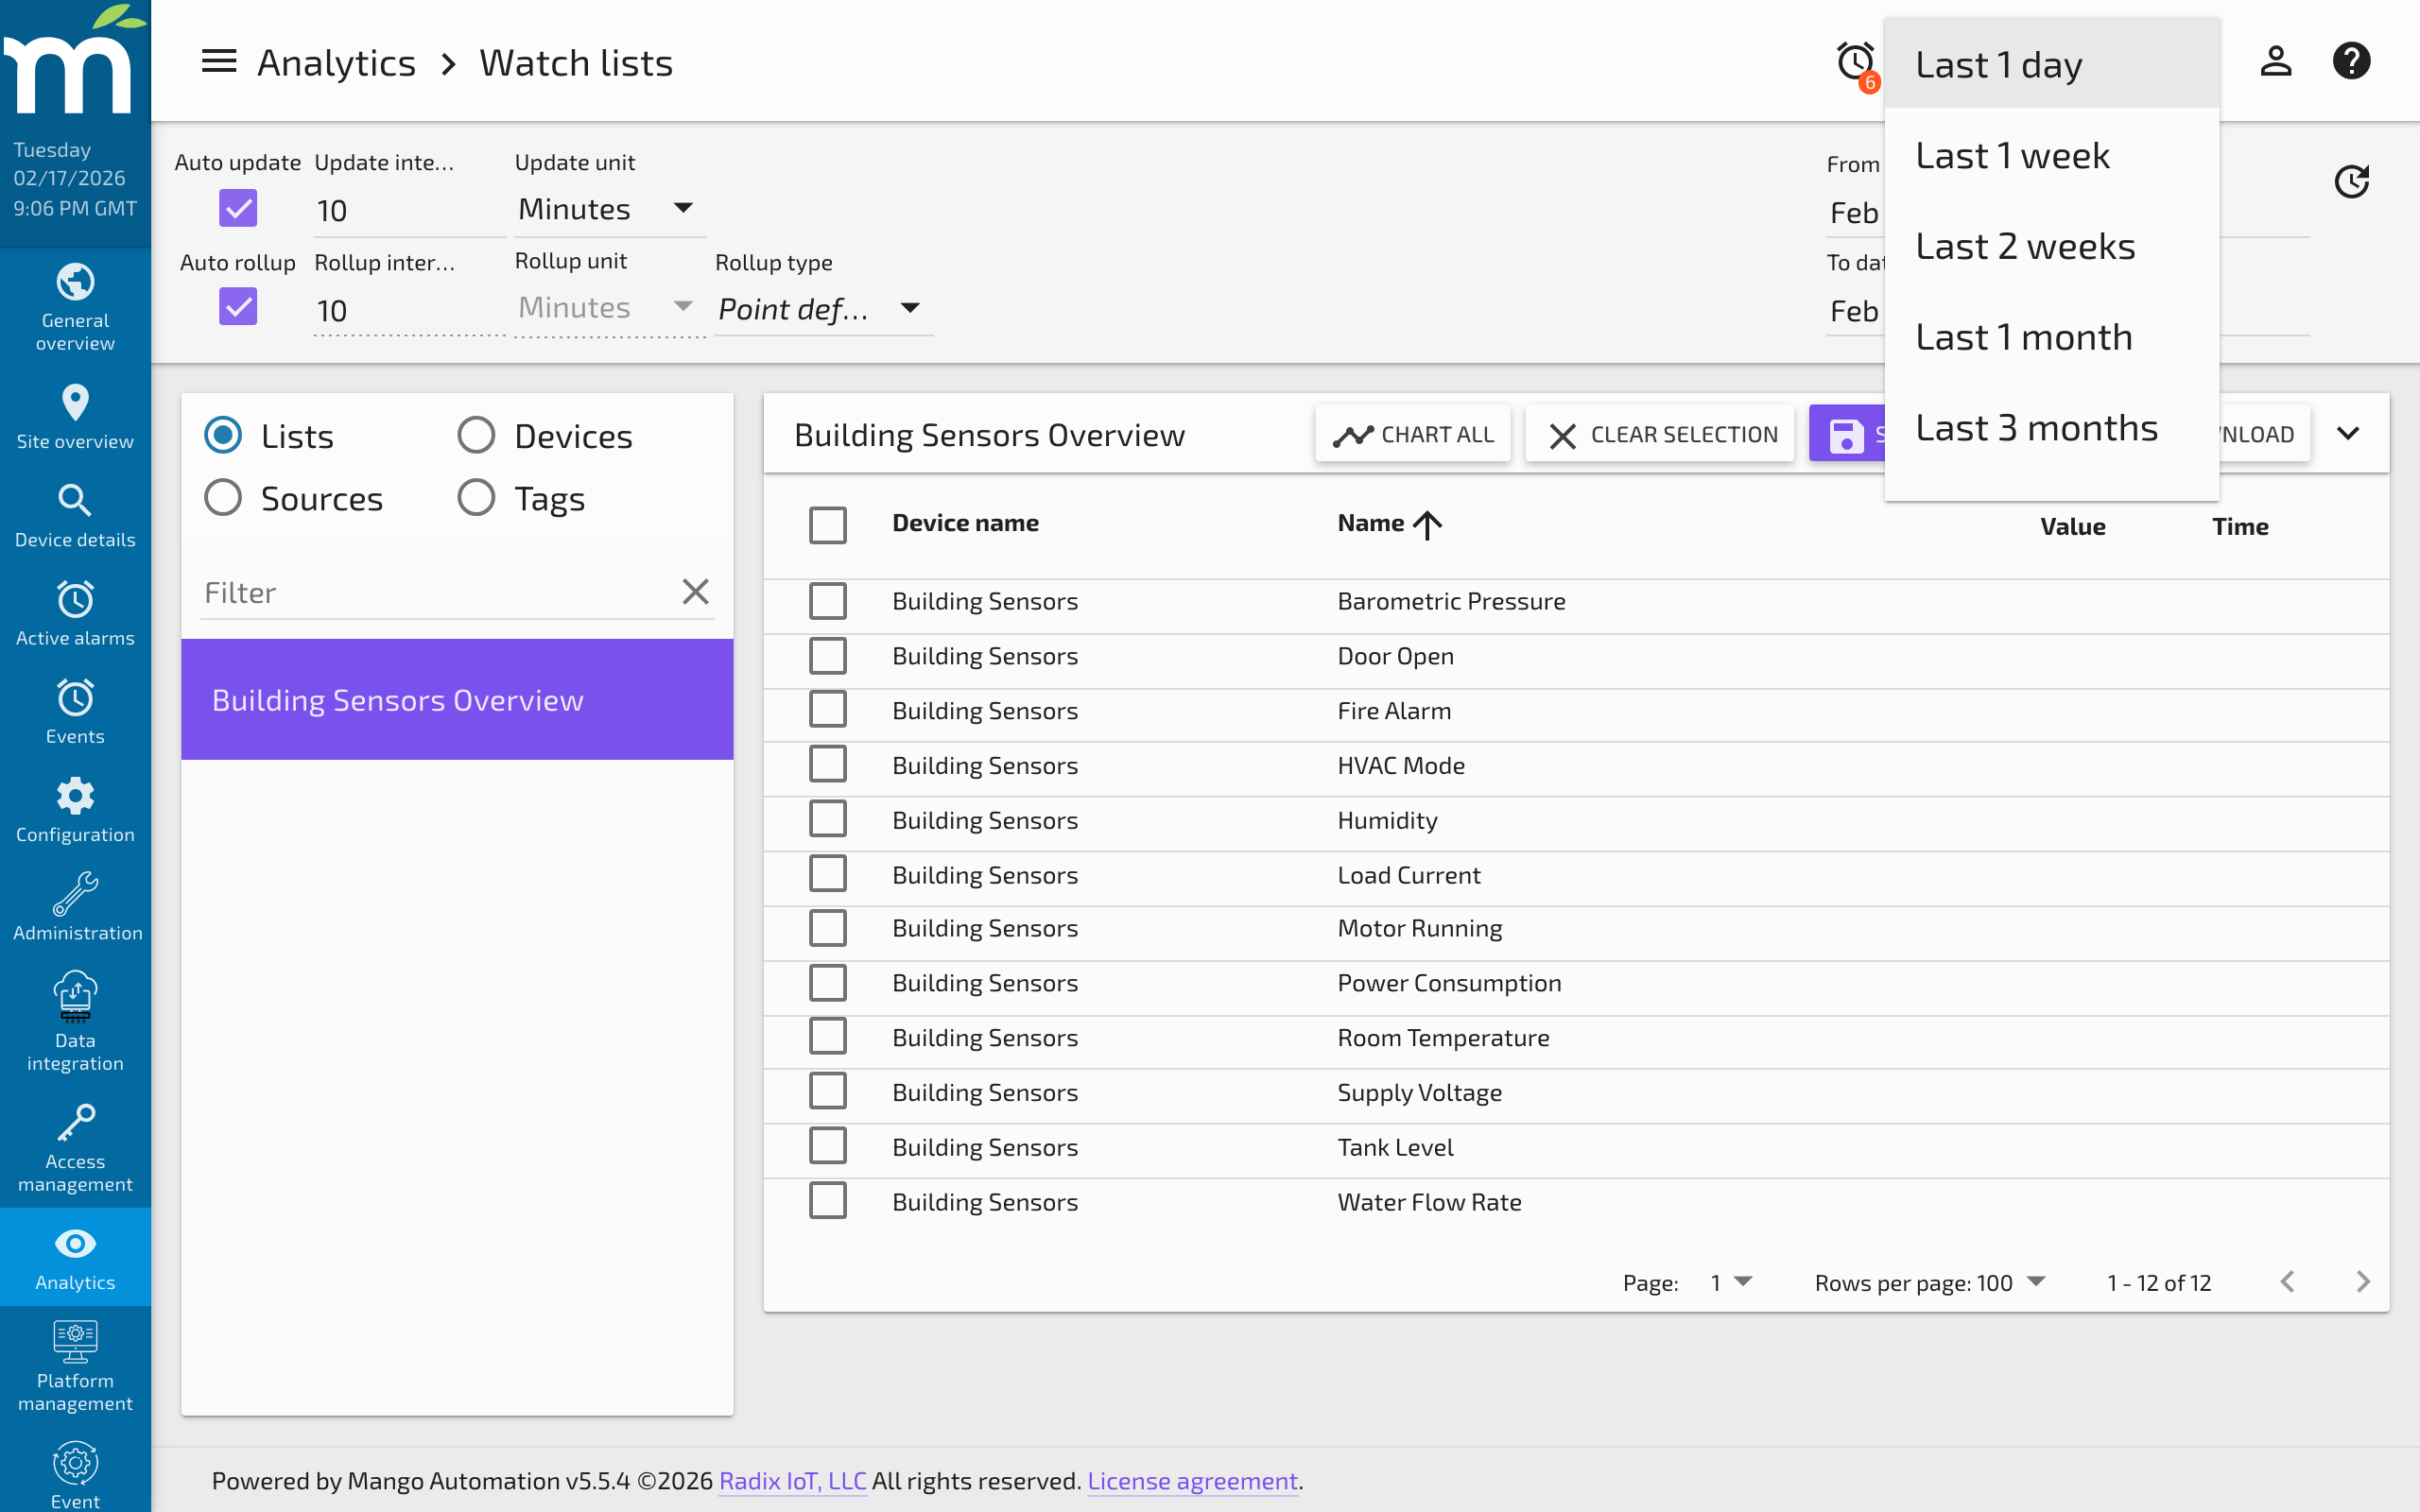
Click the calendar icon to expand the advanced selector.
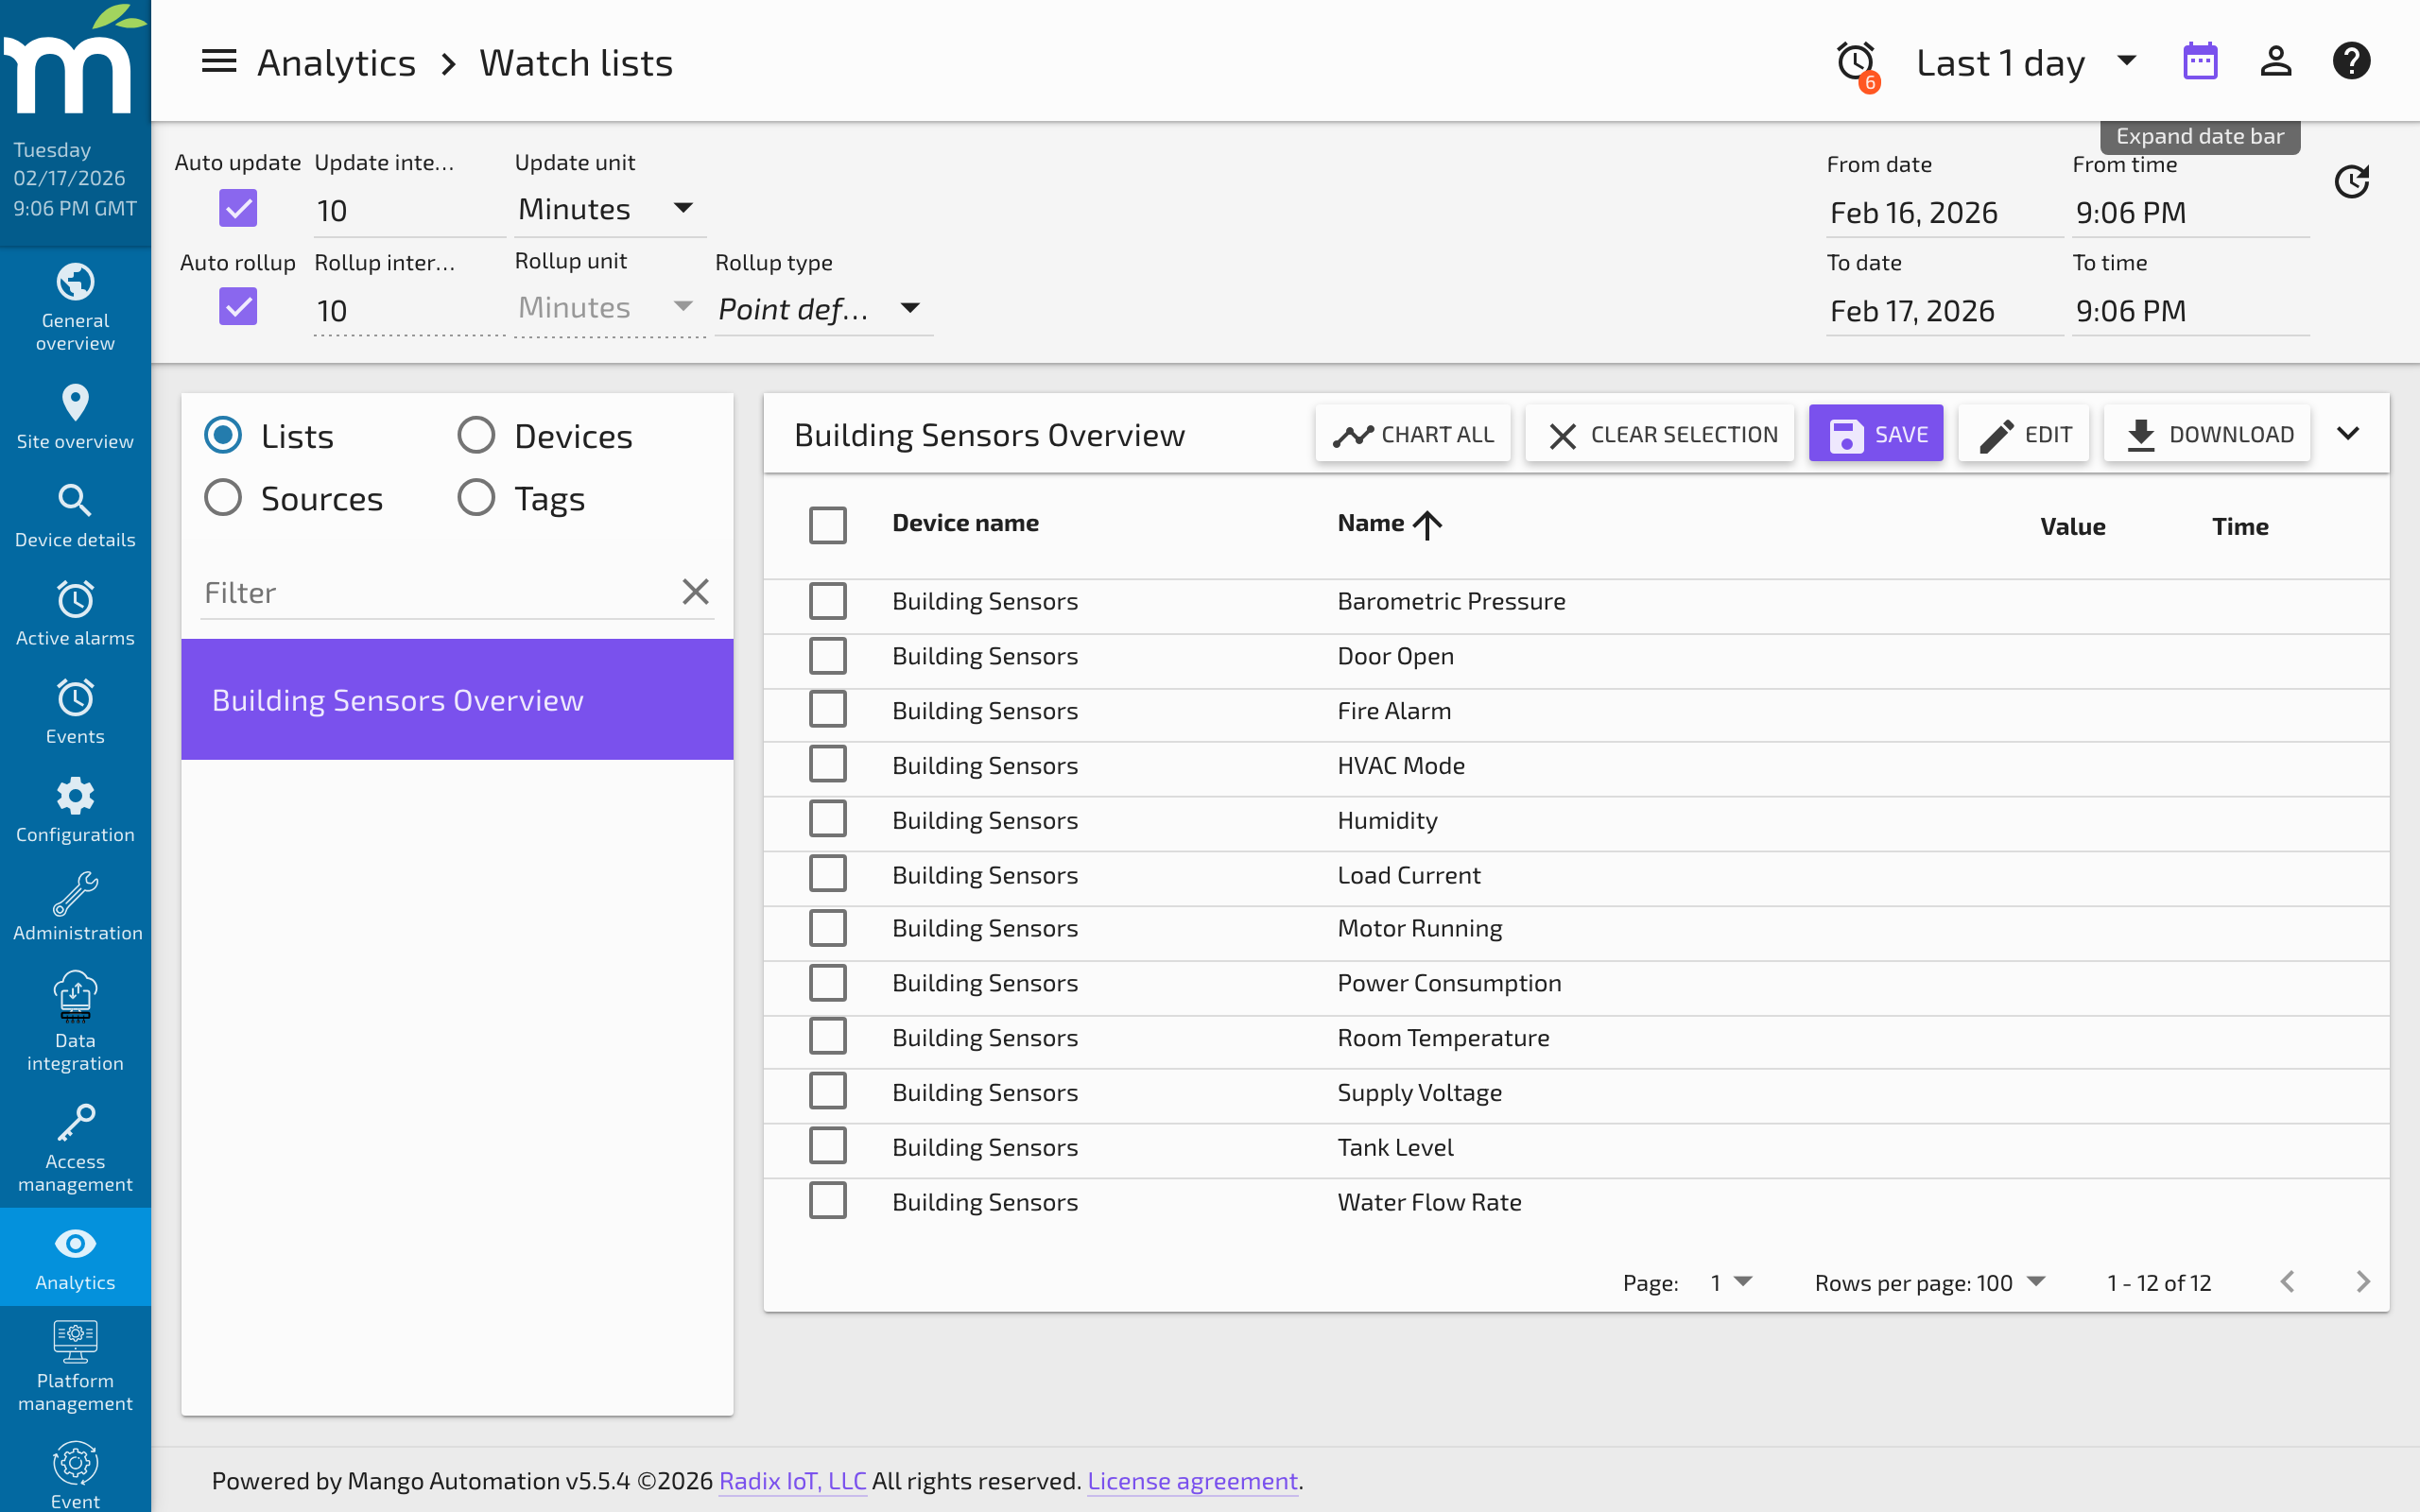
In the advanced selector you can choose individual dates and times. You will also find update intervals, the rollup interval, and the rollup type. Each data point in Mango has a configurable rollup type, and you can override it here to view data with a different rollup. You can also select the chart type.
Configuring Point Display Settings
In the data point settings you can preset these values. You will find a rollup type and a plot type. For example, if you have a kWh register or a water meter register that acts as an accumulator and keeps counting up, you may want to chart that as a Delta with a bar chart.
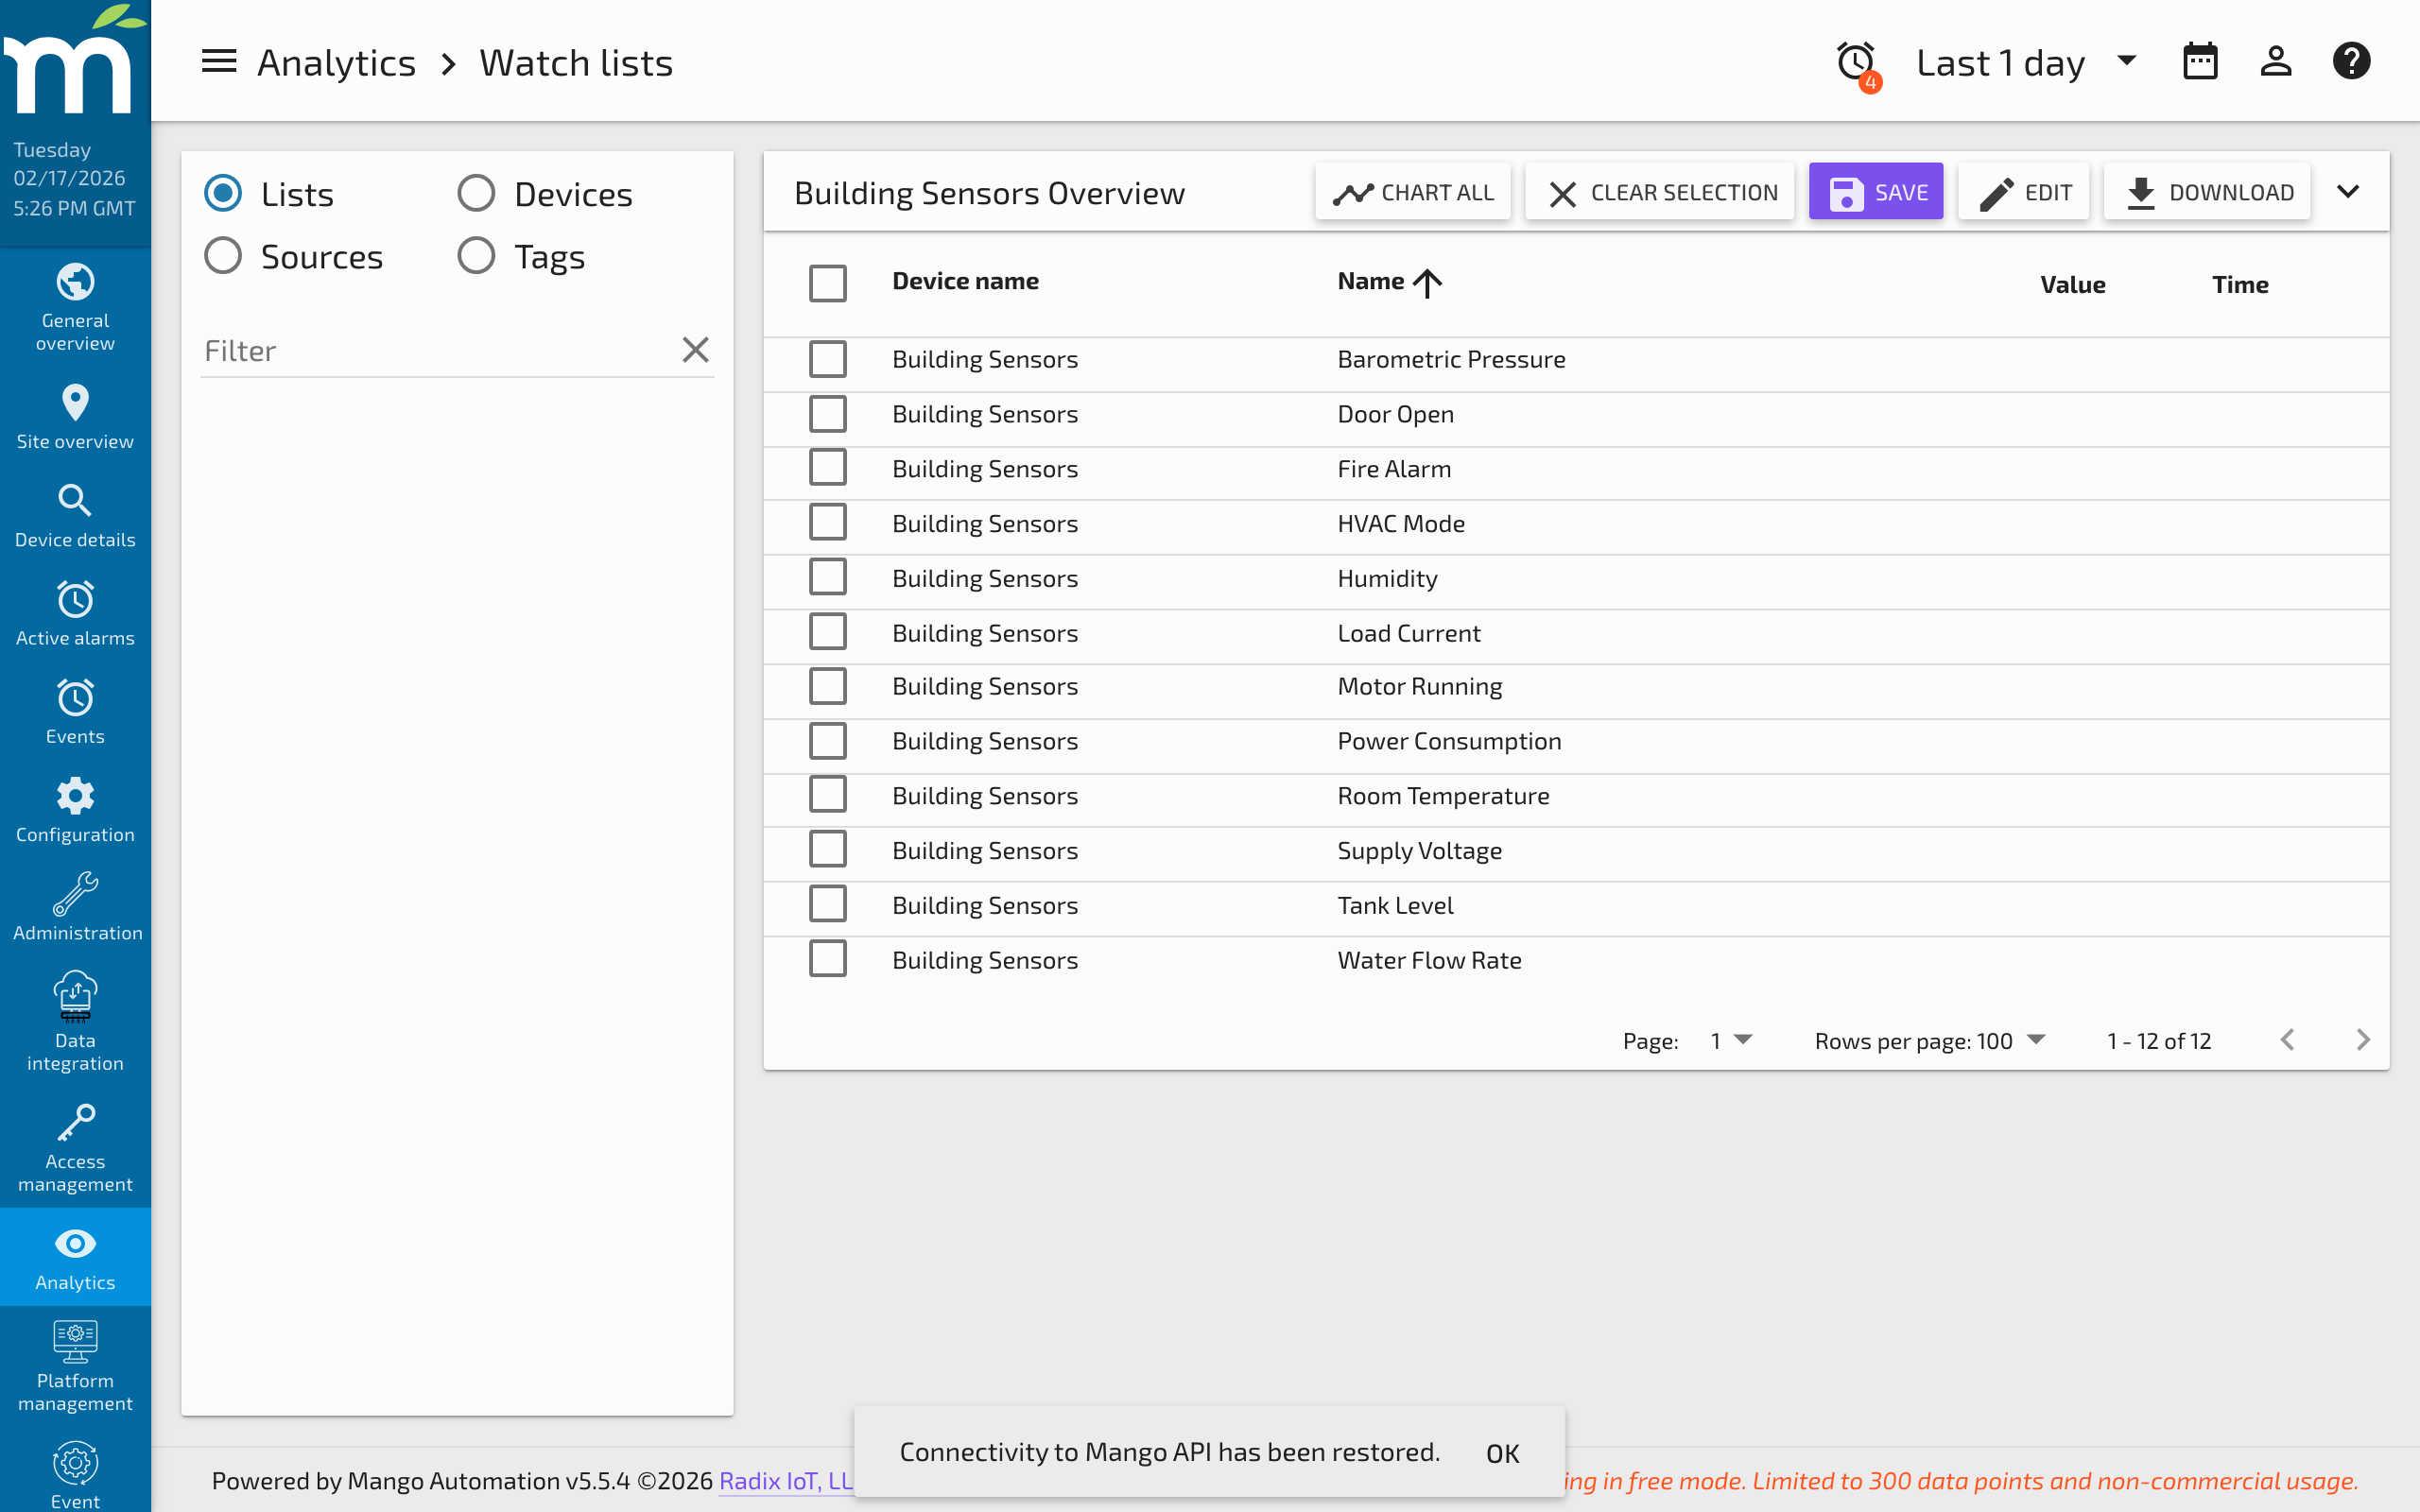
Watch Lists
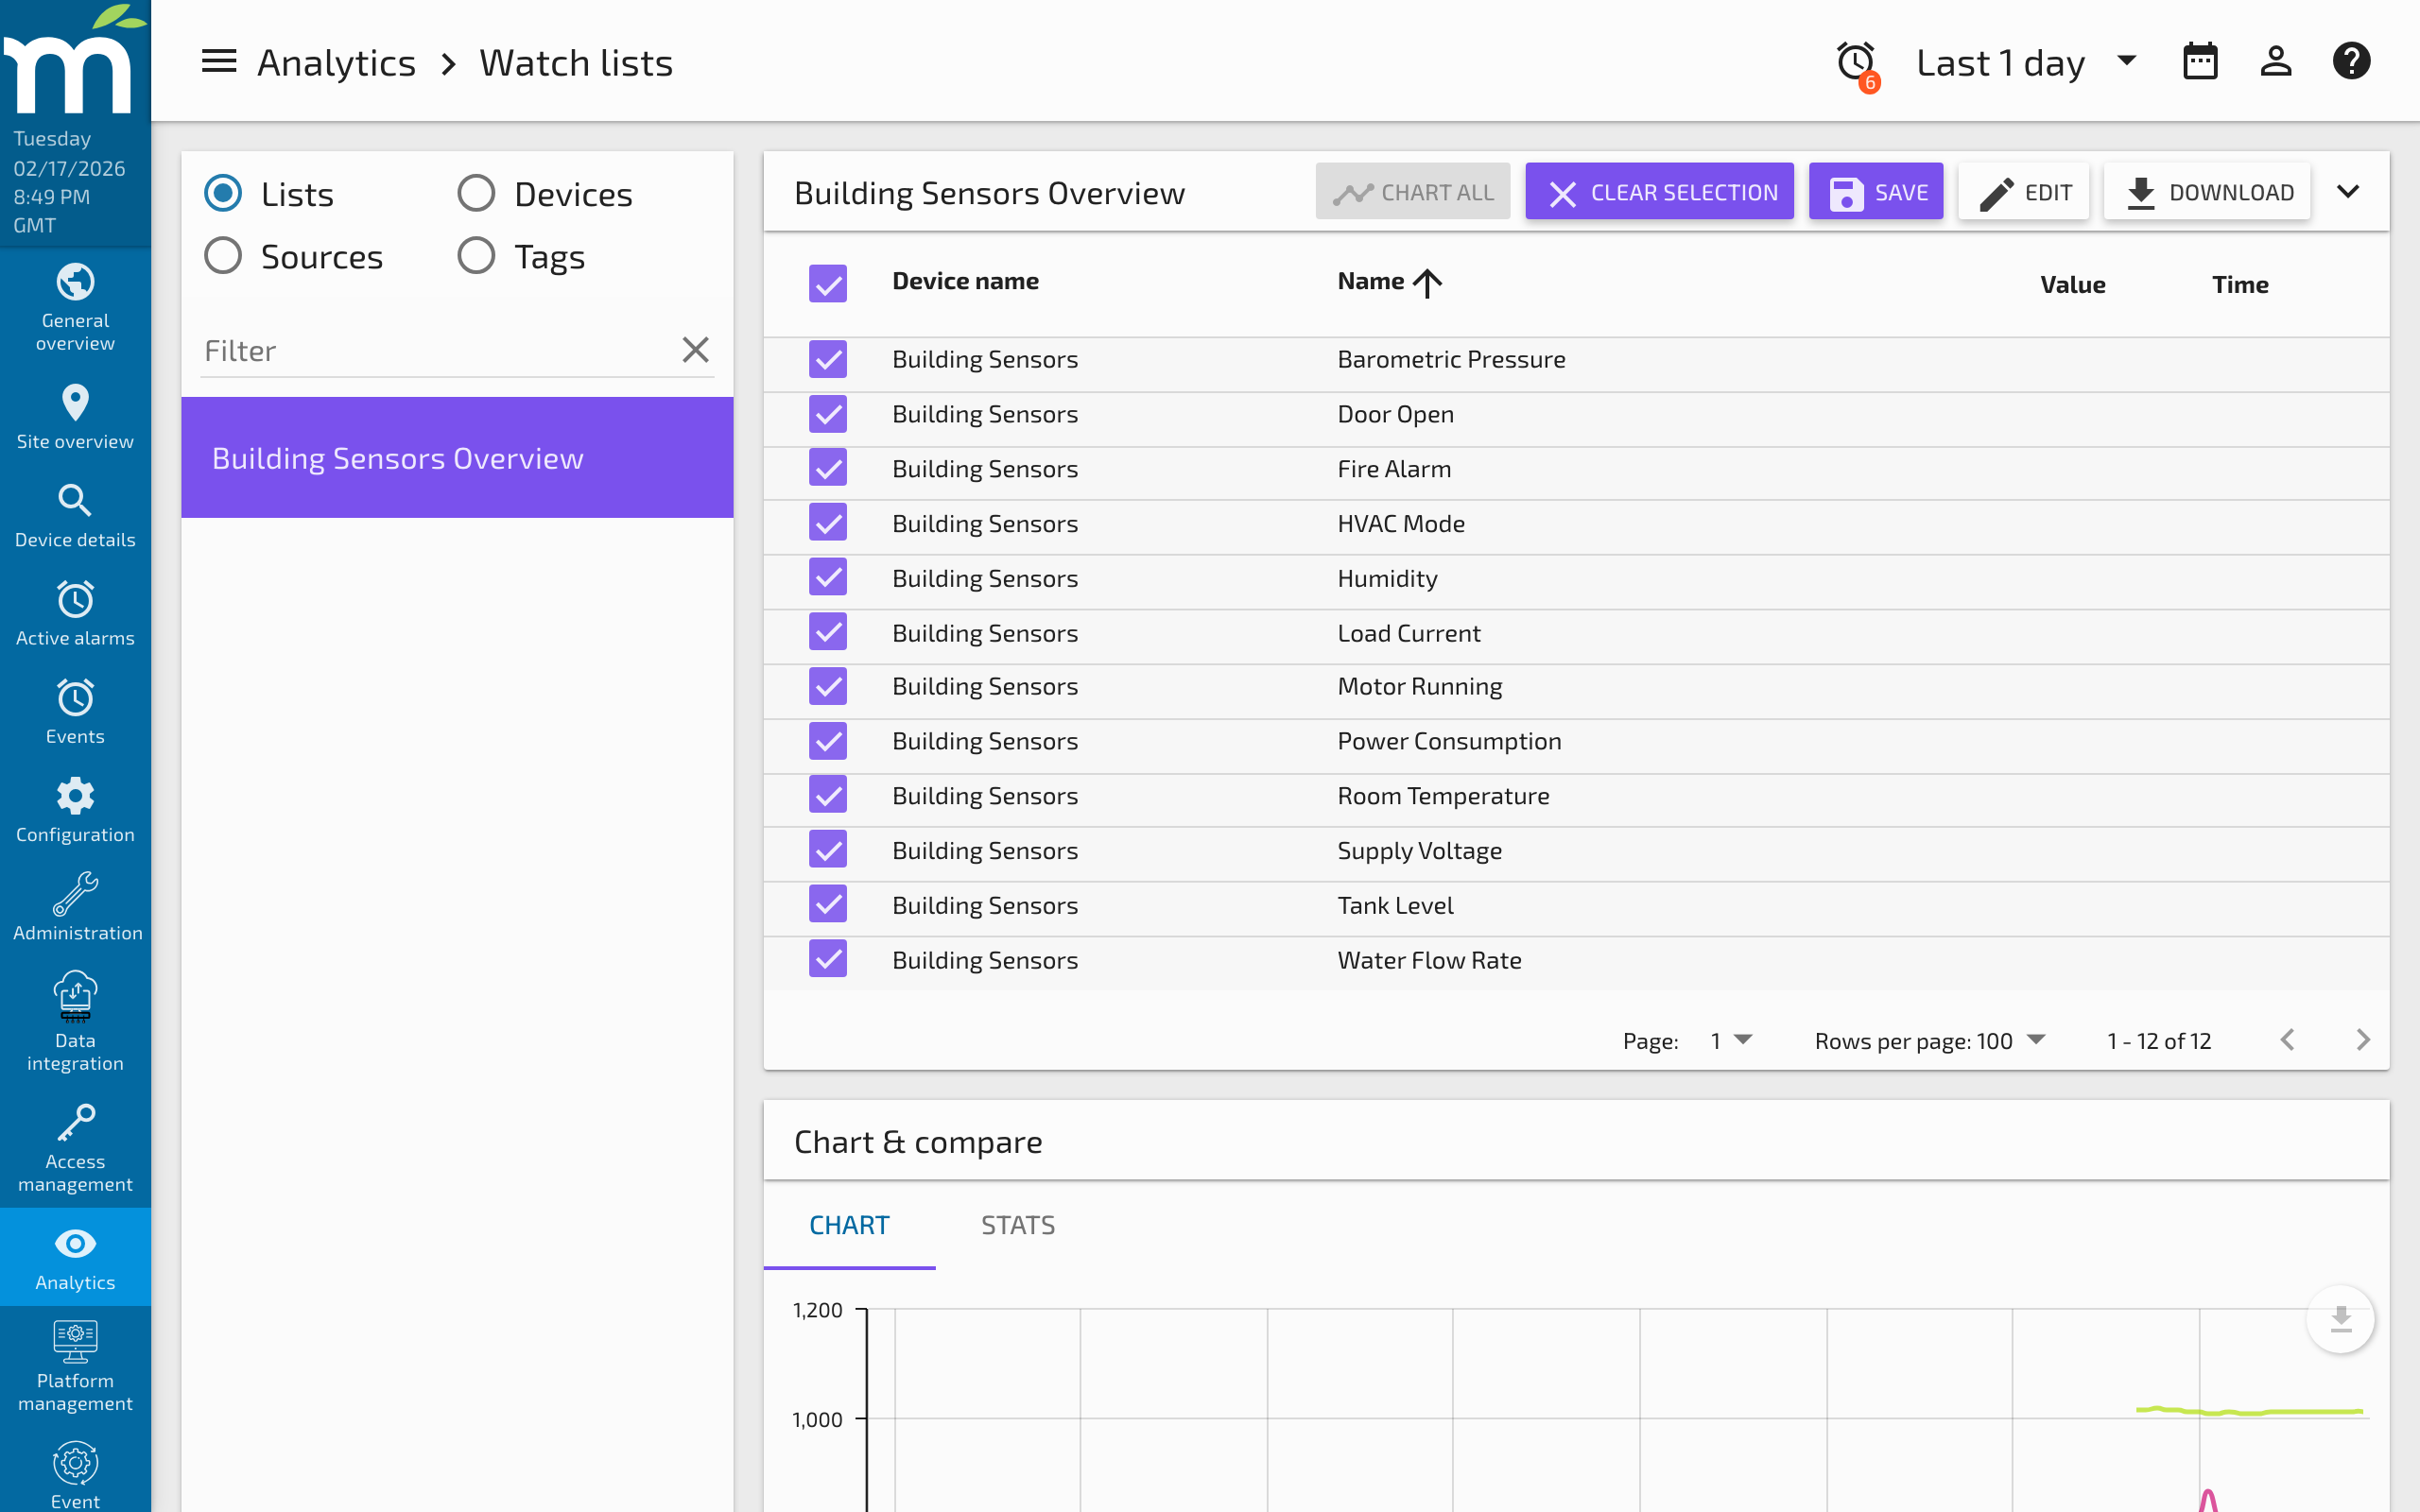
The Watch List allows you to view combinations of data in a common list and configure a chart to display them. The top section shows real-time values that flash as they update. The chart is fully configurable -- you can combine data points on different series and select the chart type to display.
Watch list charts can be embedded in custom pages. You can also change data point values directly from the chart view and see a quick statistical summary.
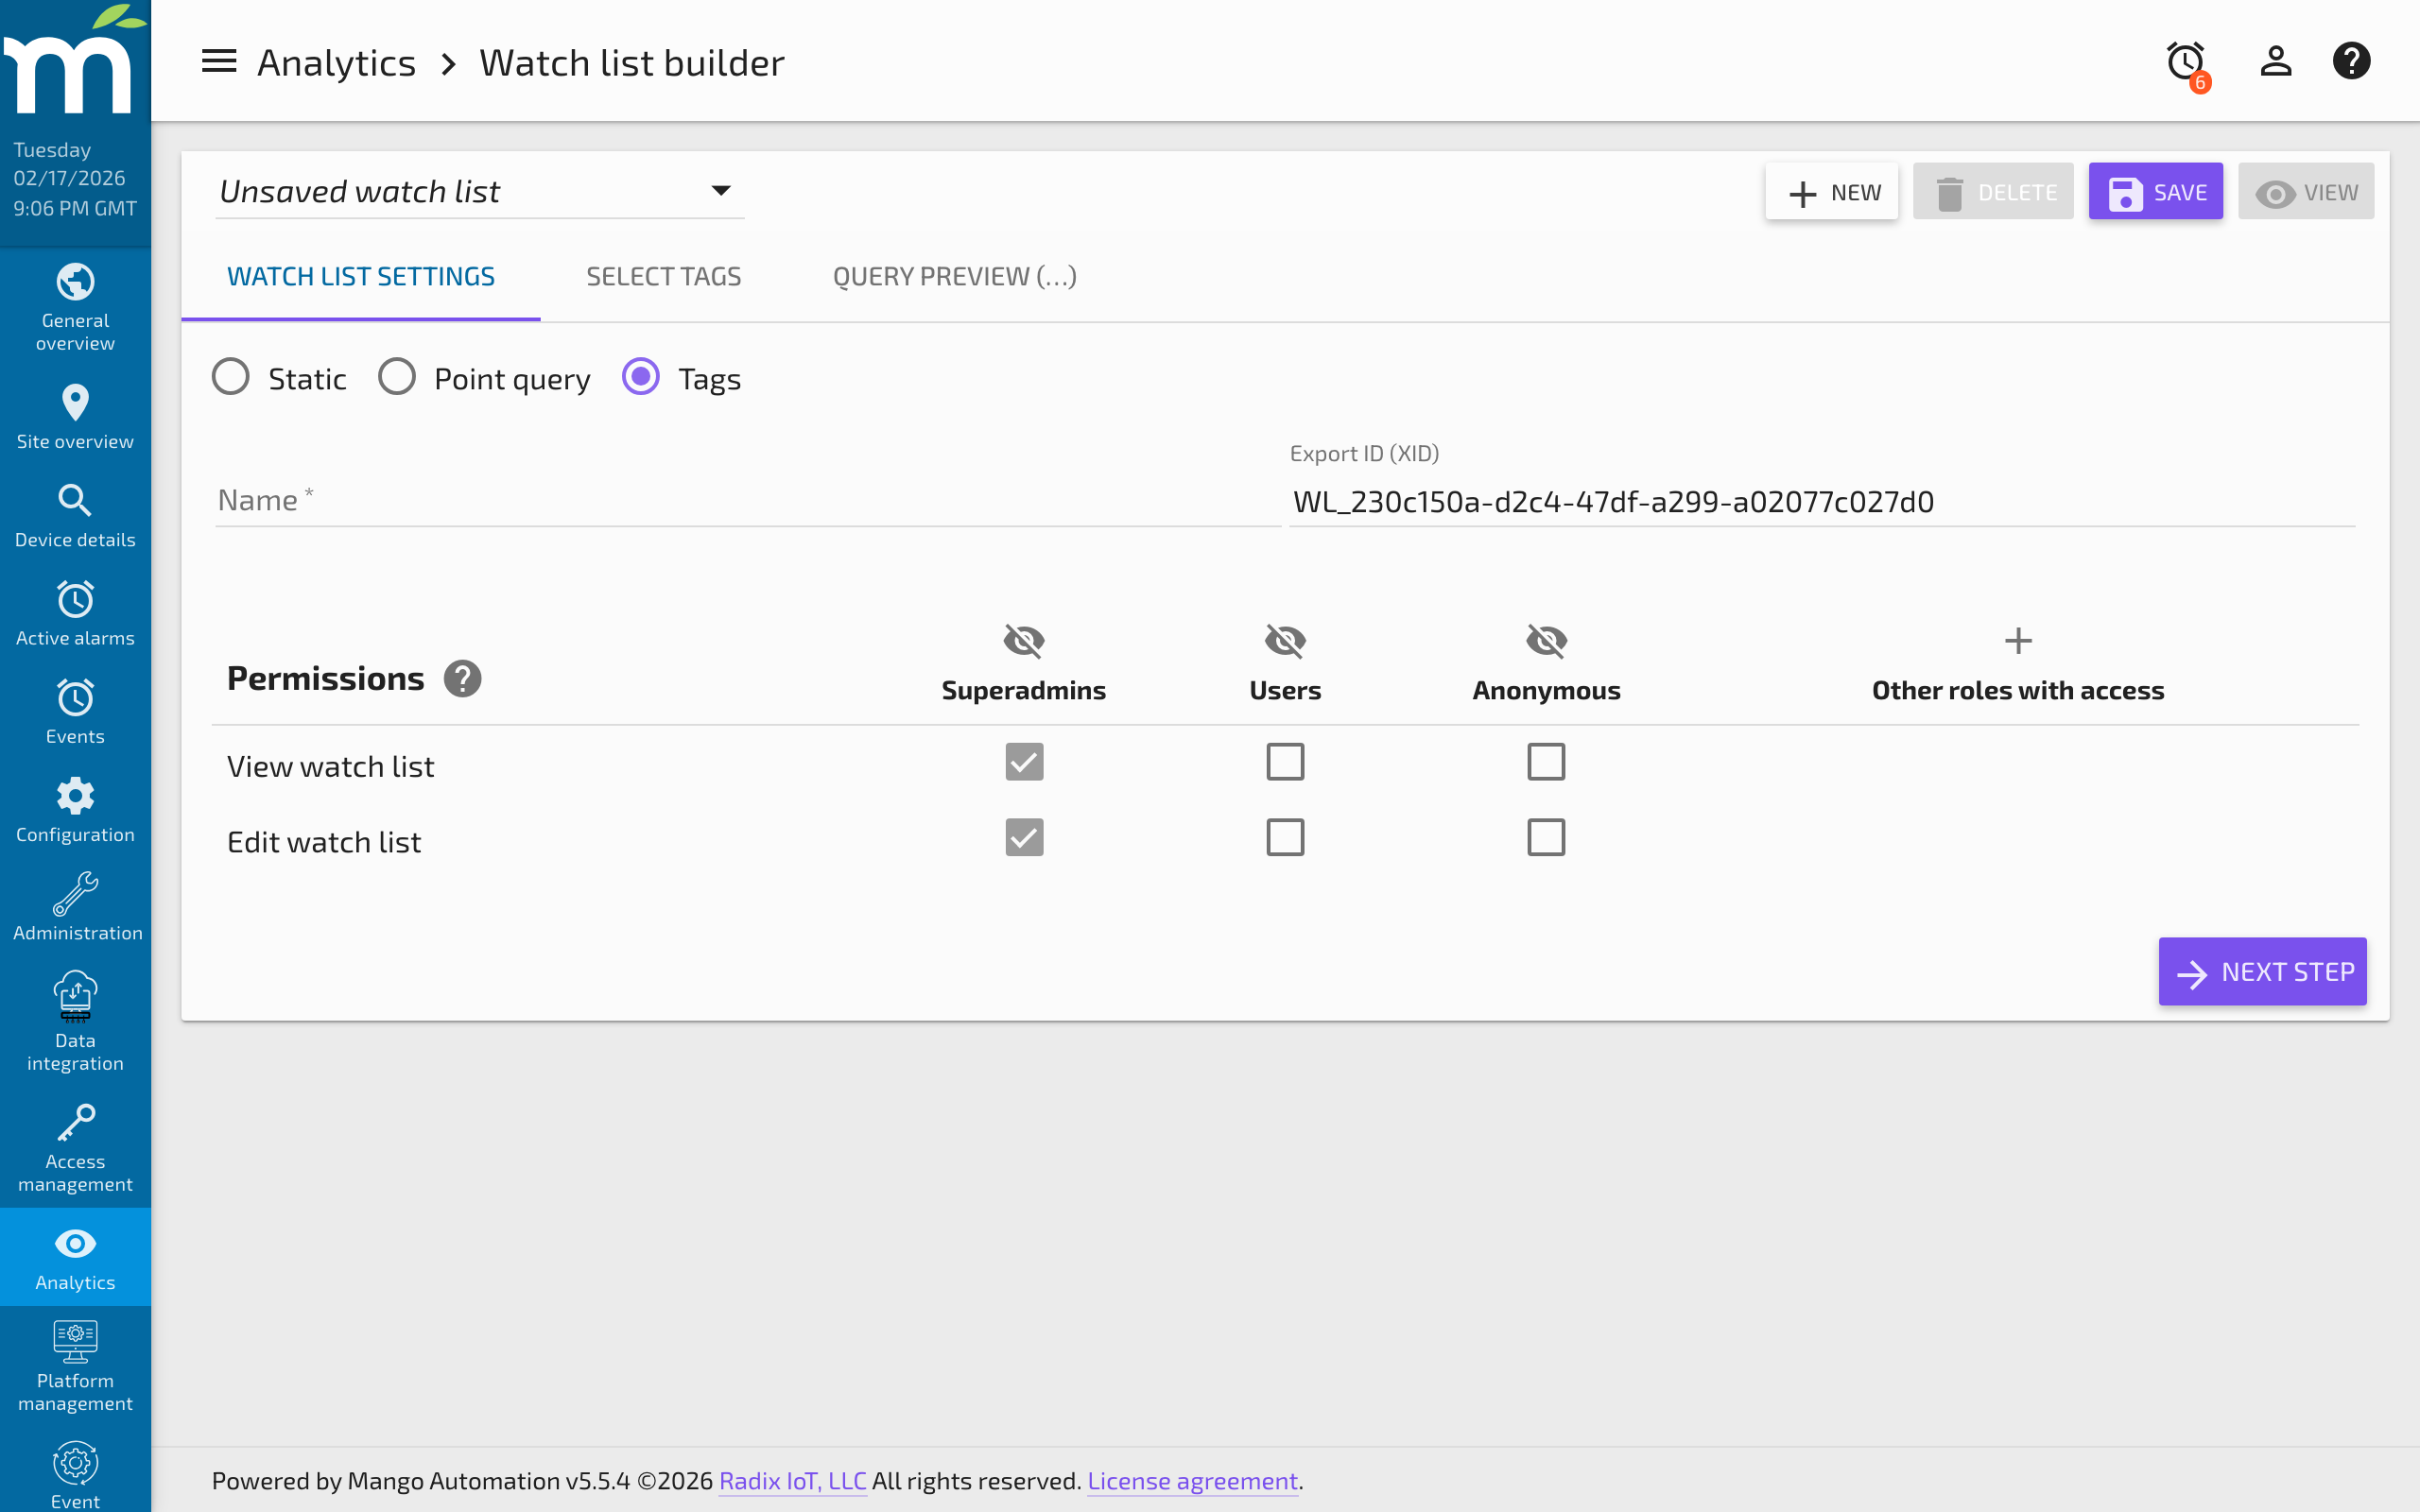
Creating Watch Lists
You can create a new watch list by clicking the Watch List Builder button. Three types are available:
- Static -- The simplest type. Select a fixed group of data points to display.
- Point Query -- More advanced. Use queries and expressions to build a dynamic watch list, which can also be used in the Dashboard Designer.
- Tags -- Filter data points by their tags.
Events
Events are alarms or notifications that have been configured in the system. There are several ways to filter and view them.
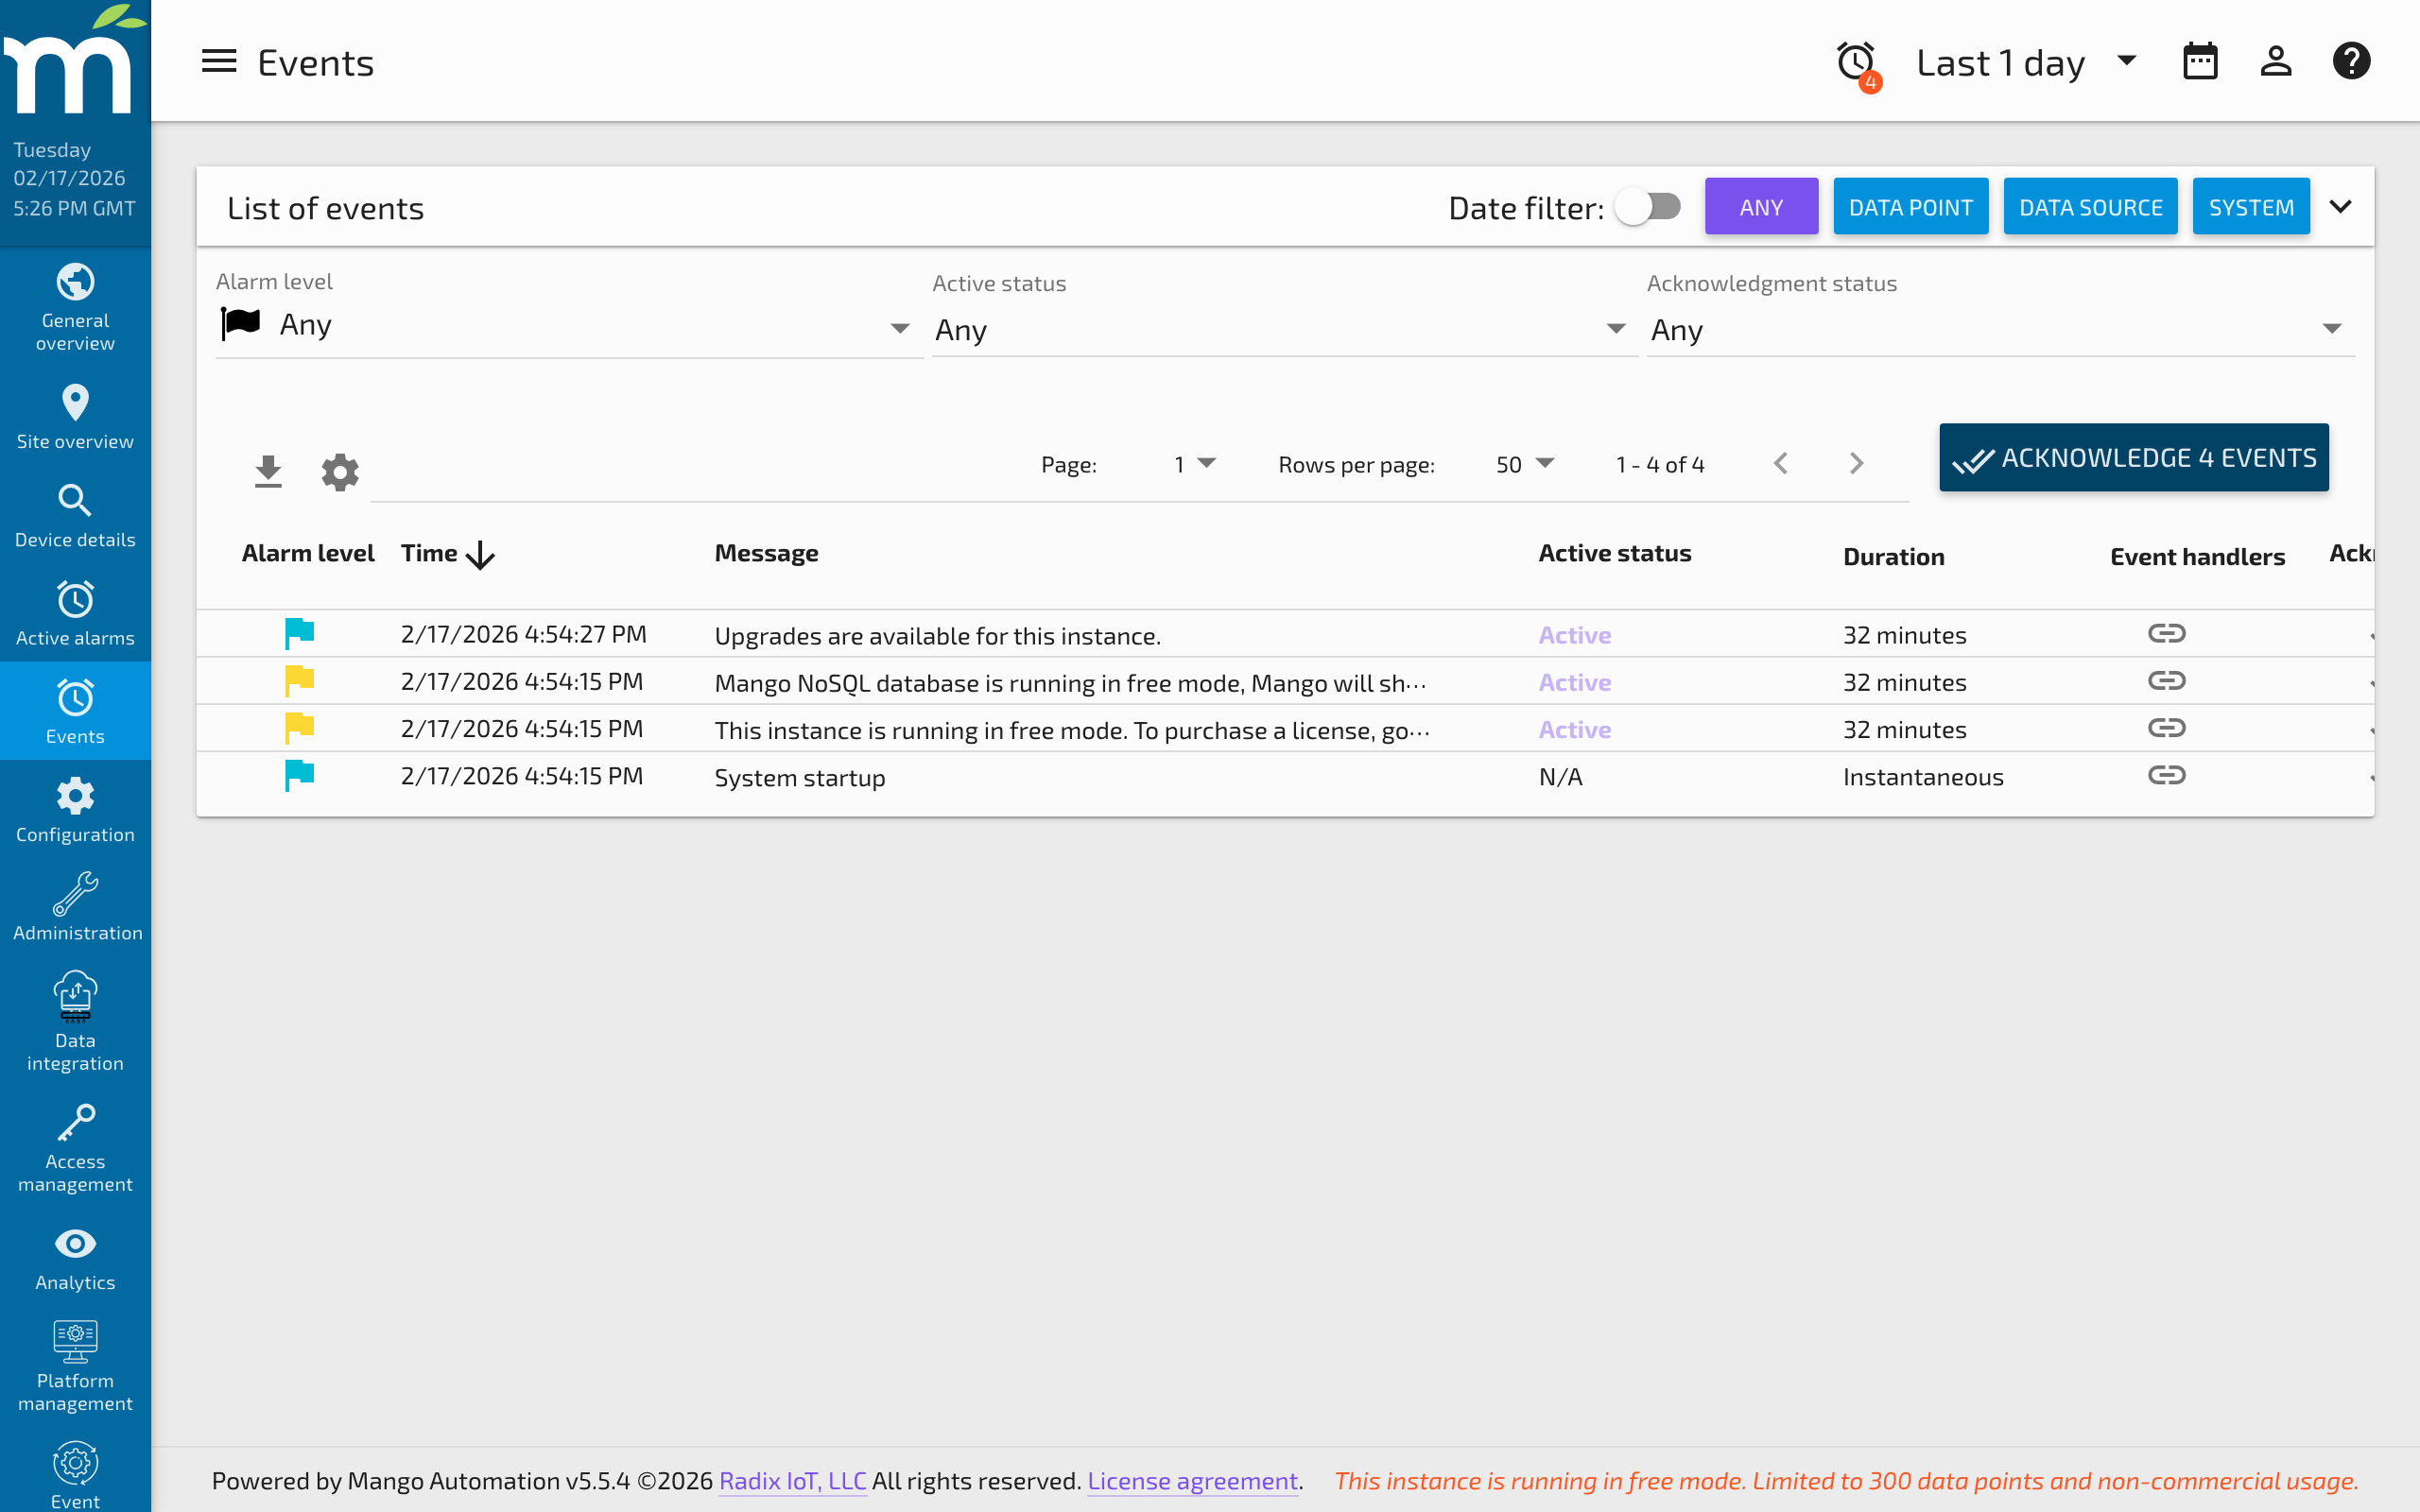
At the top you can filter by event source:
- Data Point Events -- Individual event detectors such as high-level limits, low-level limits, or other detector types.
- Data Source Events -- Communication timeouts, connection errors, and other data source exceptions.
- System Events -- User logins, system startups, and other system-level event types.
You can further filter by alarm level, status, and acknowledgment state. Use the acknowledge button to acknowledge events directly from this screen.
Administration
Under the Administration menu you will find tools to create data sources, build custom pages, manage users, and access other system tools.
Help
The help menu provides contextual tips and detailed information about the features available on each page of the user interface.
Custom Dashboards and Pages
Mango's UI is a powerful development framework for creating custom dashboards and applications. Under the Administration menu you will find:
- Edit Menu -- Create your own menu items that link to custom pages, define user permissions, and show or hide menu items as needed.
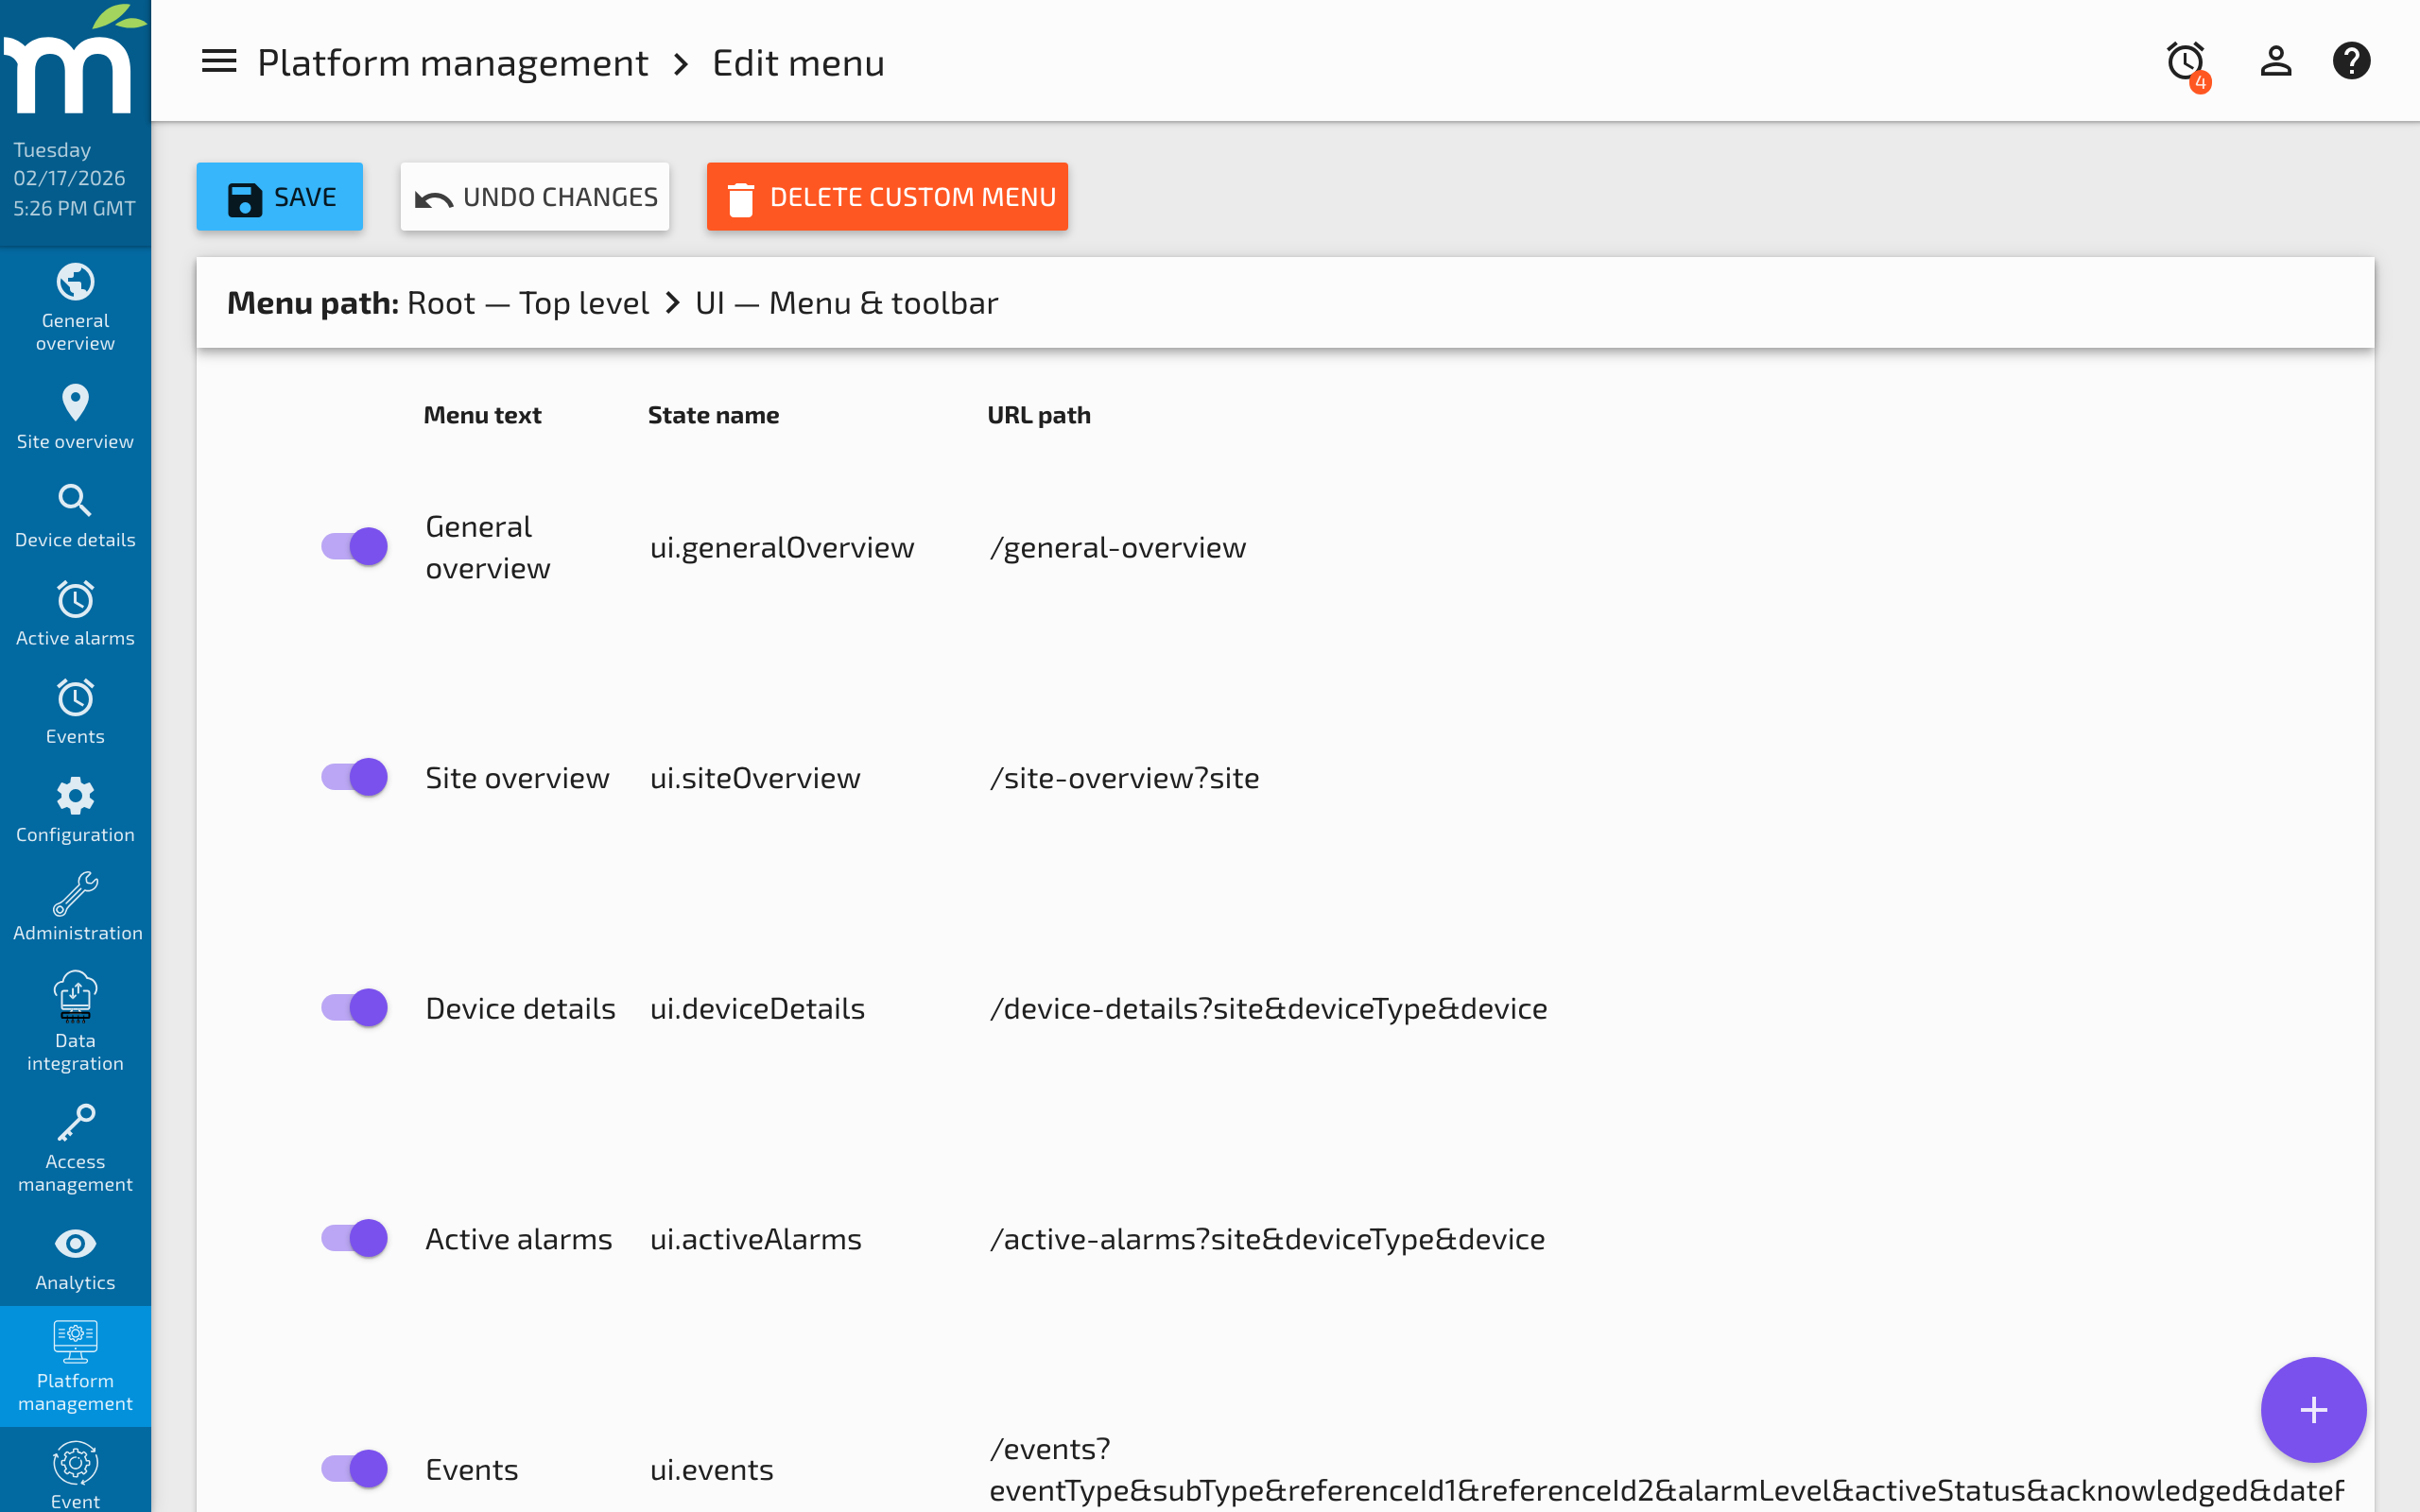
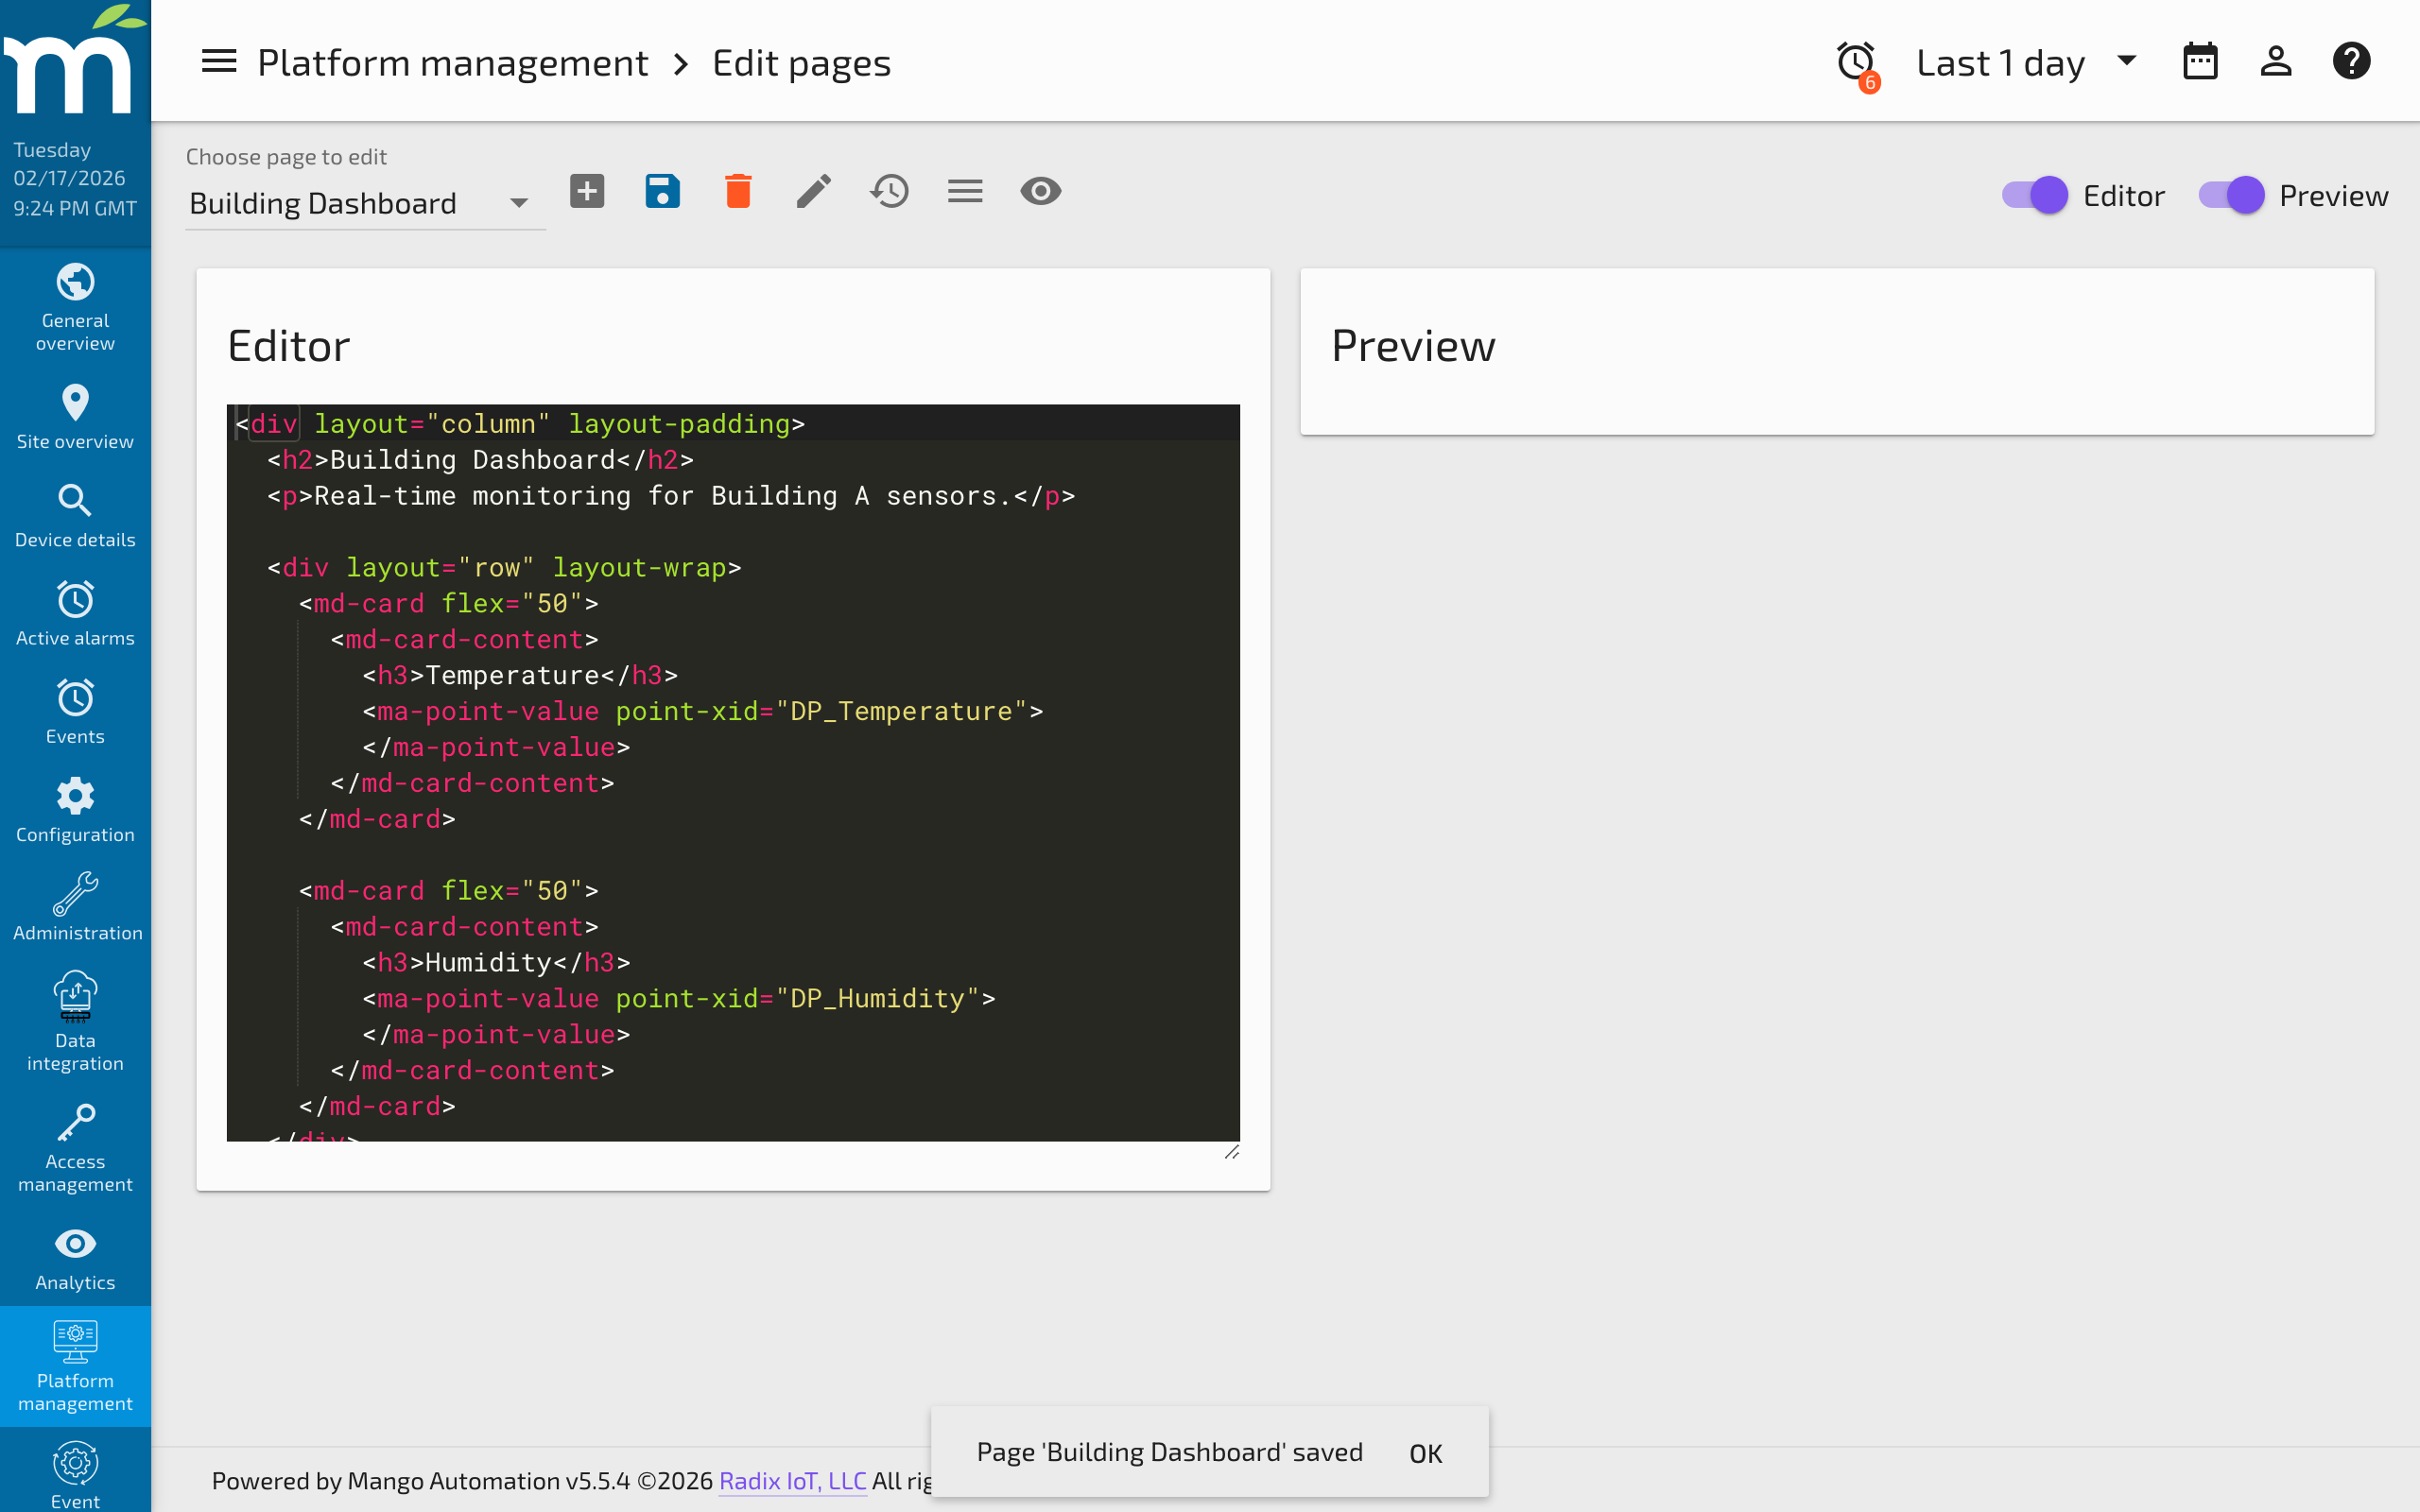
- Edit Pages -- Write custom pages using HTML code with Mango UI components.
- Dashboard Designer -- Build pages using a visual drag-and-drop editor without writing code.
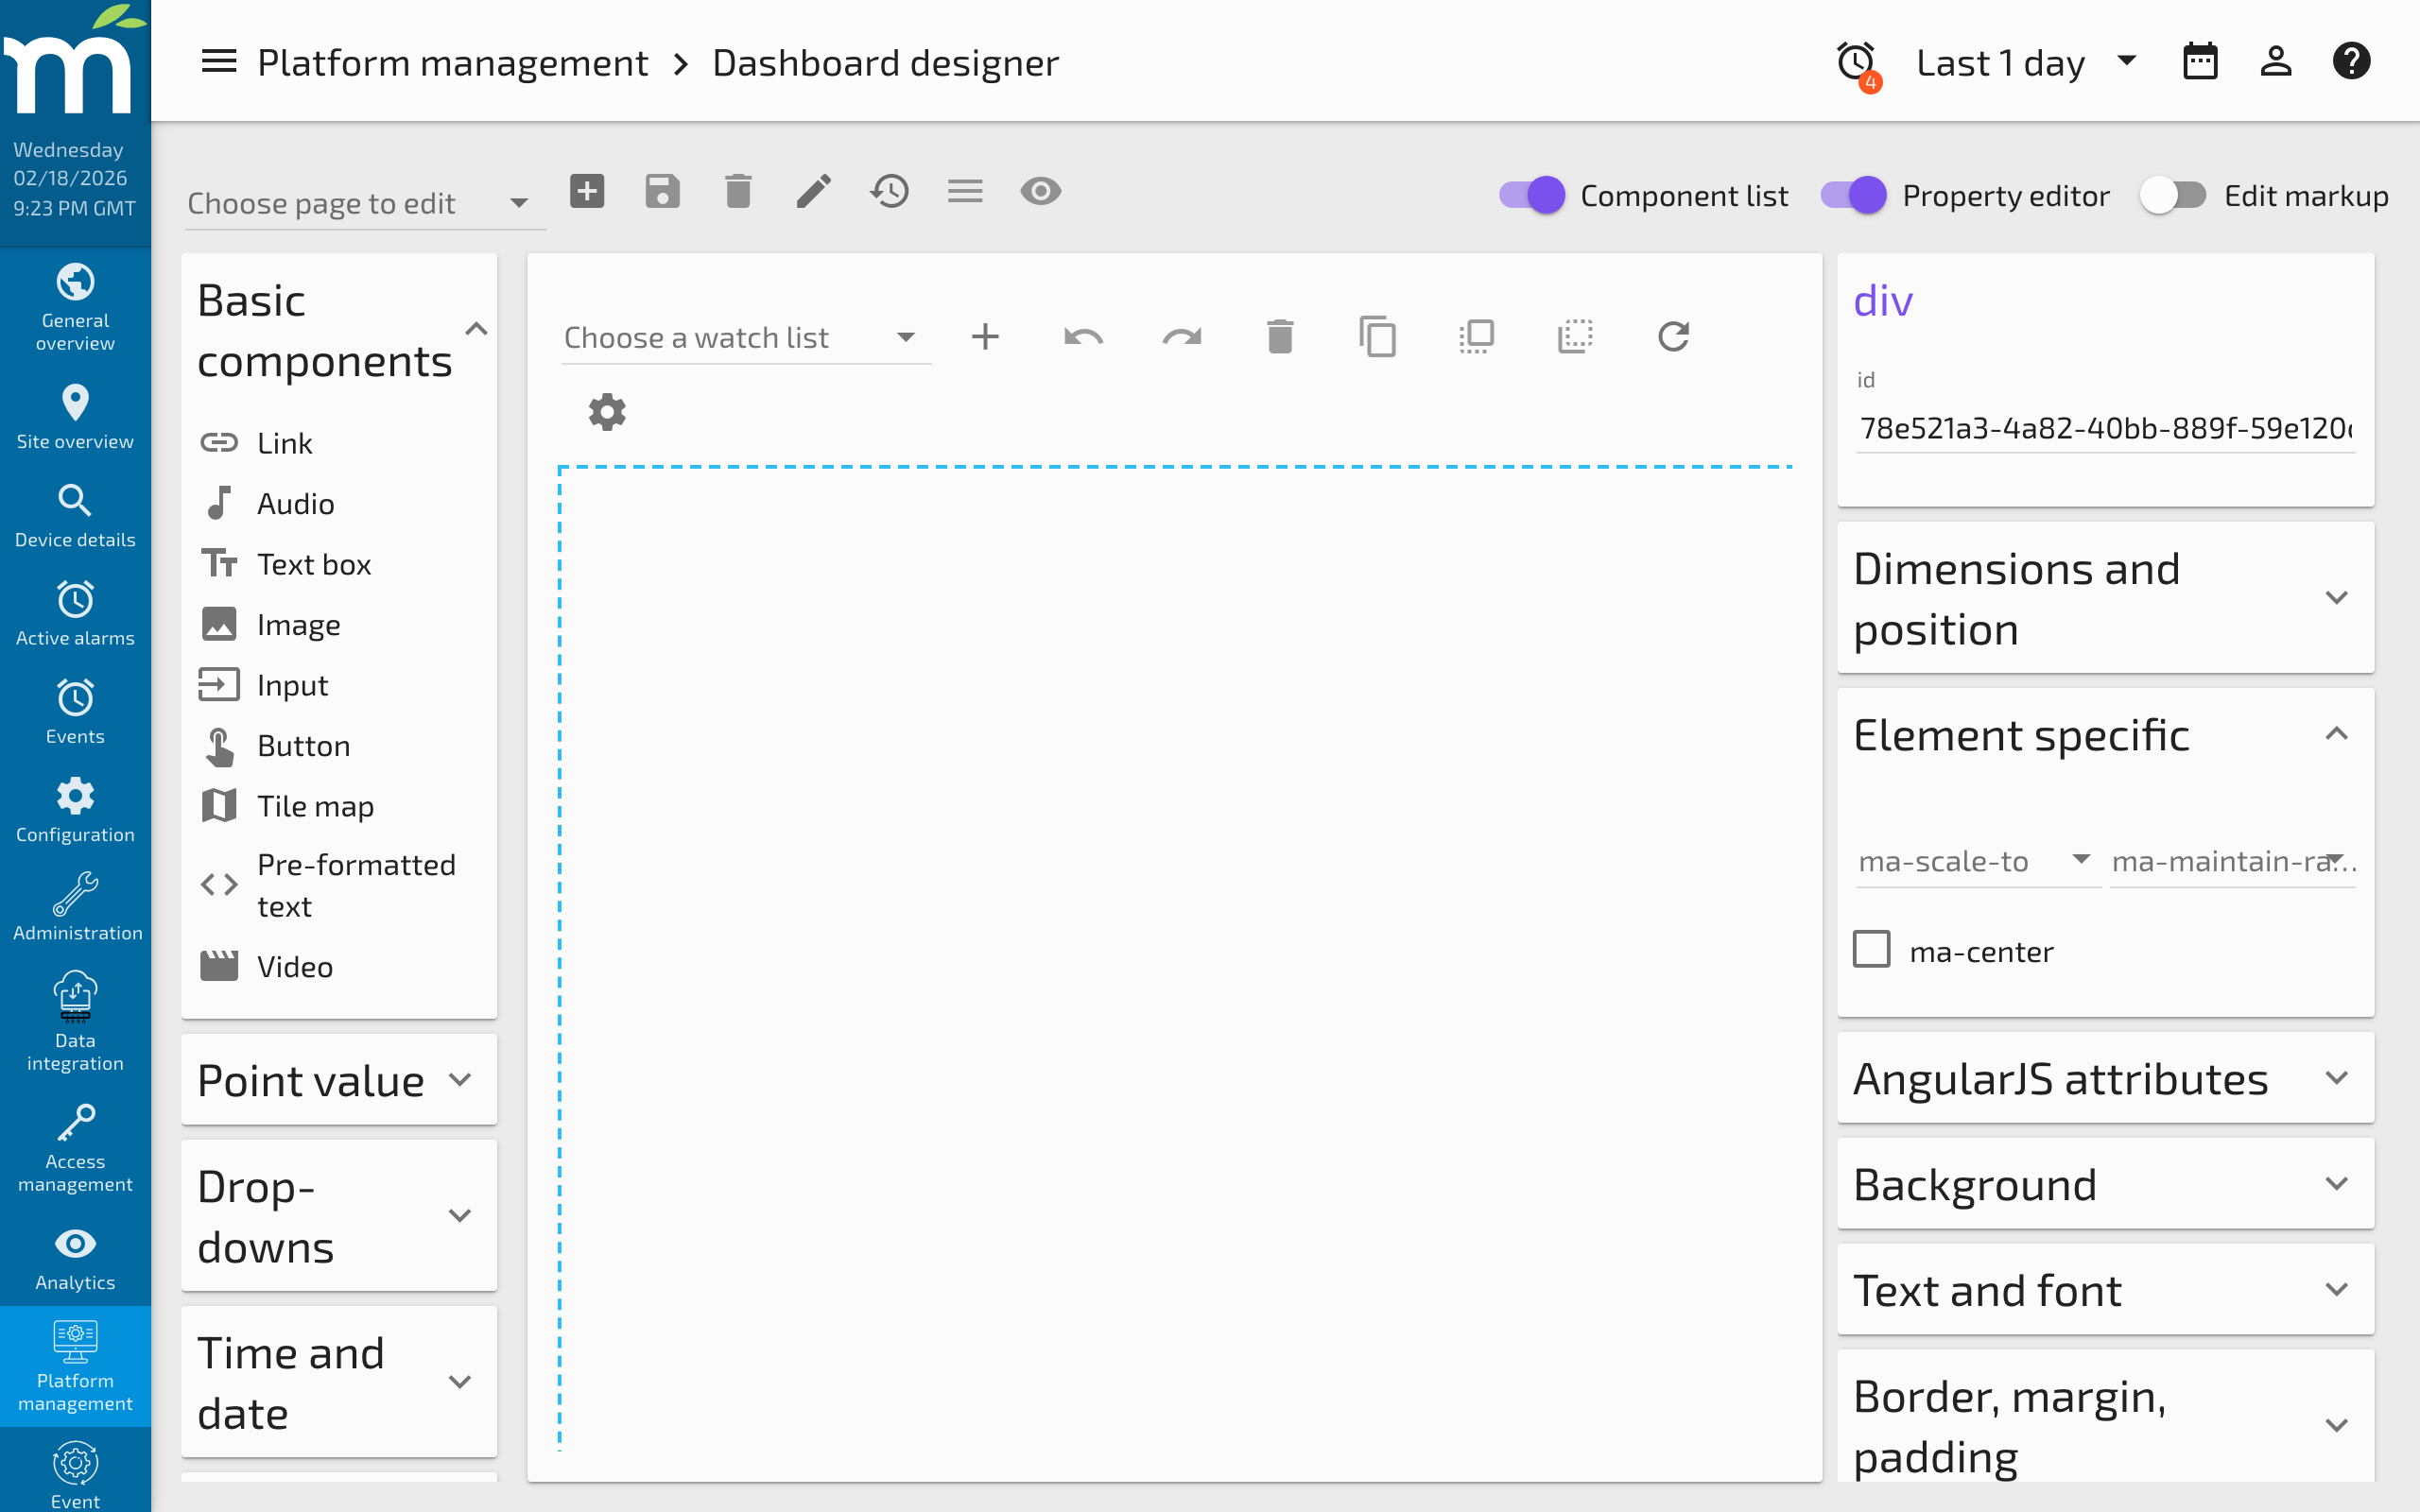
Related Pages
- What Is a Data Source? — Learn how Mango connects to devices and protocols
- What Is a Data Point? — Understand the values that flow through Mango
- UI Overview — More detailed guide to the Mango user interface
- Dashboard Designer Basic Usage — Build pages with the drag-and-drop designer