Internal Metrics
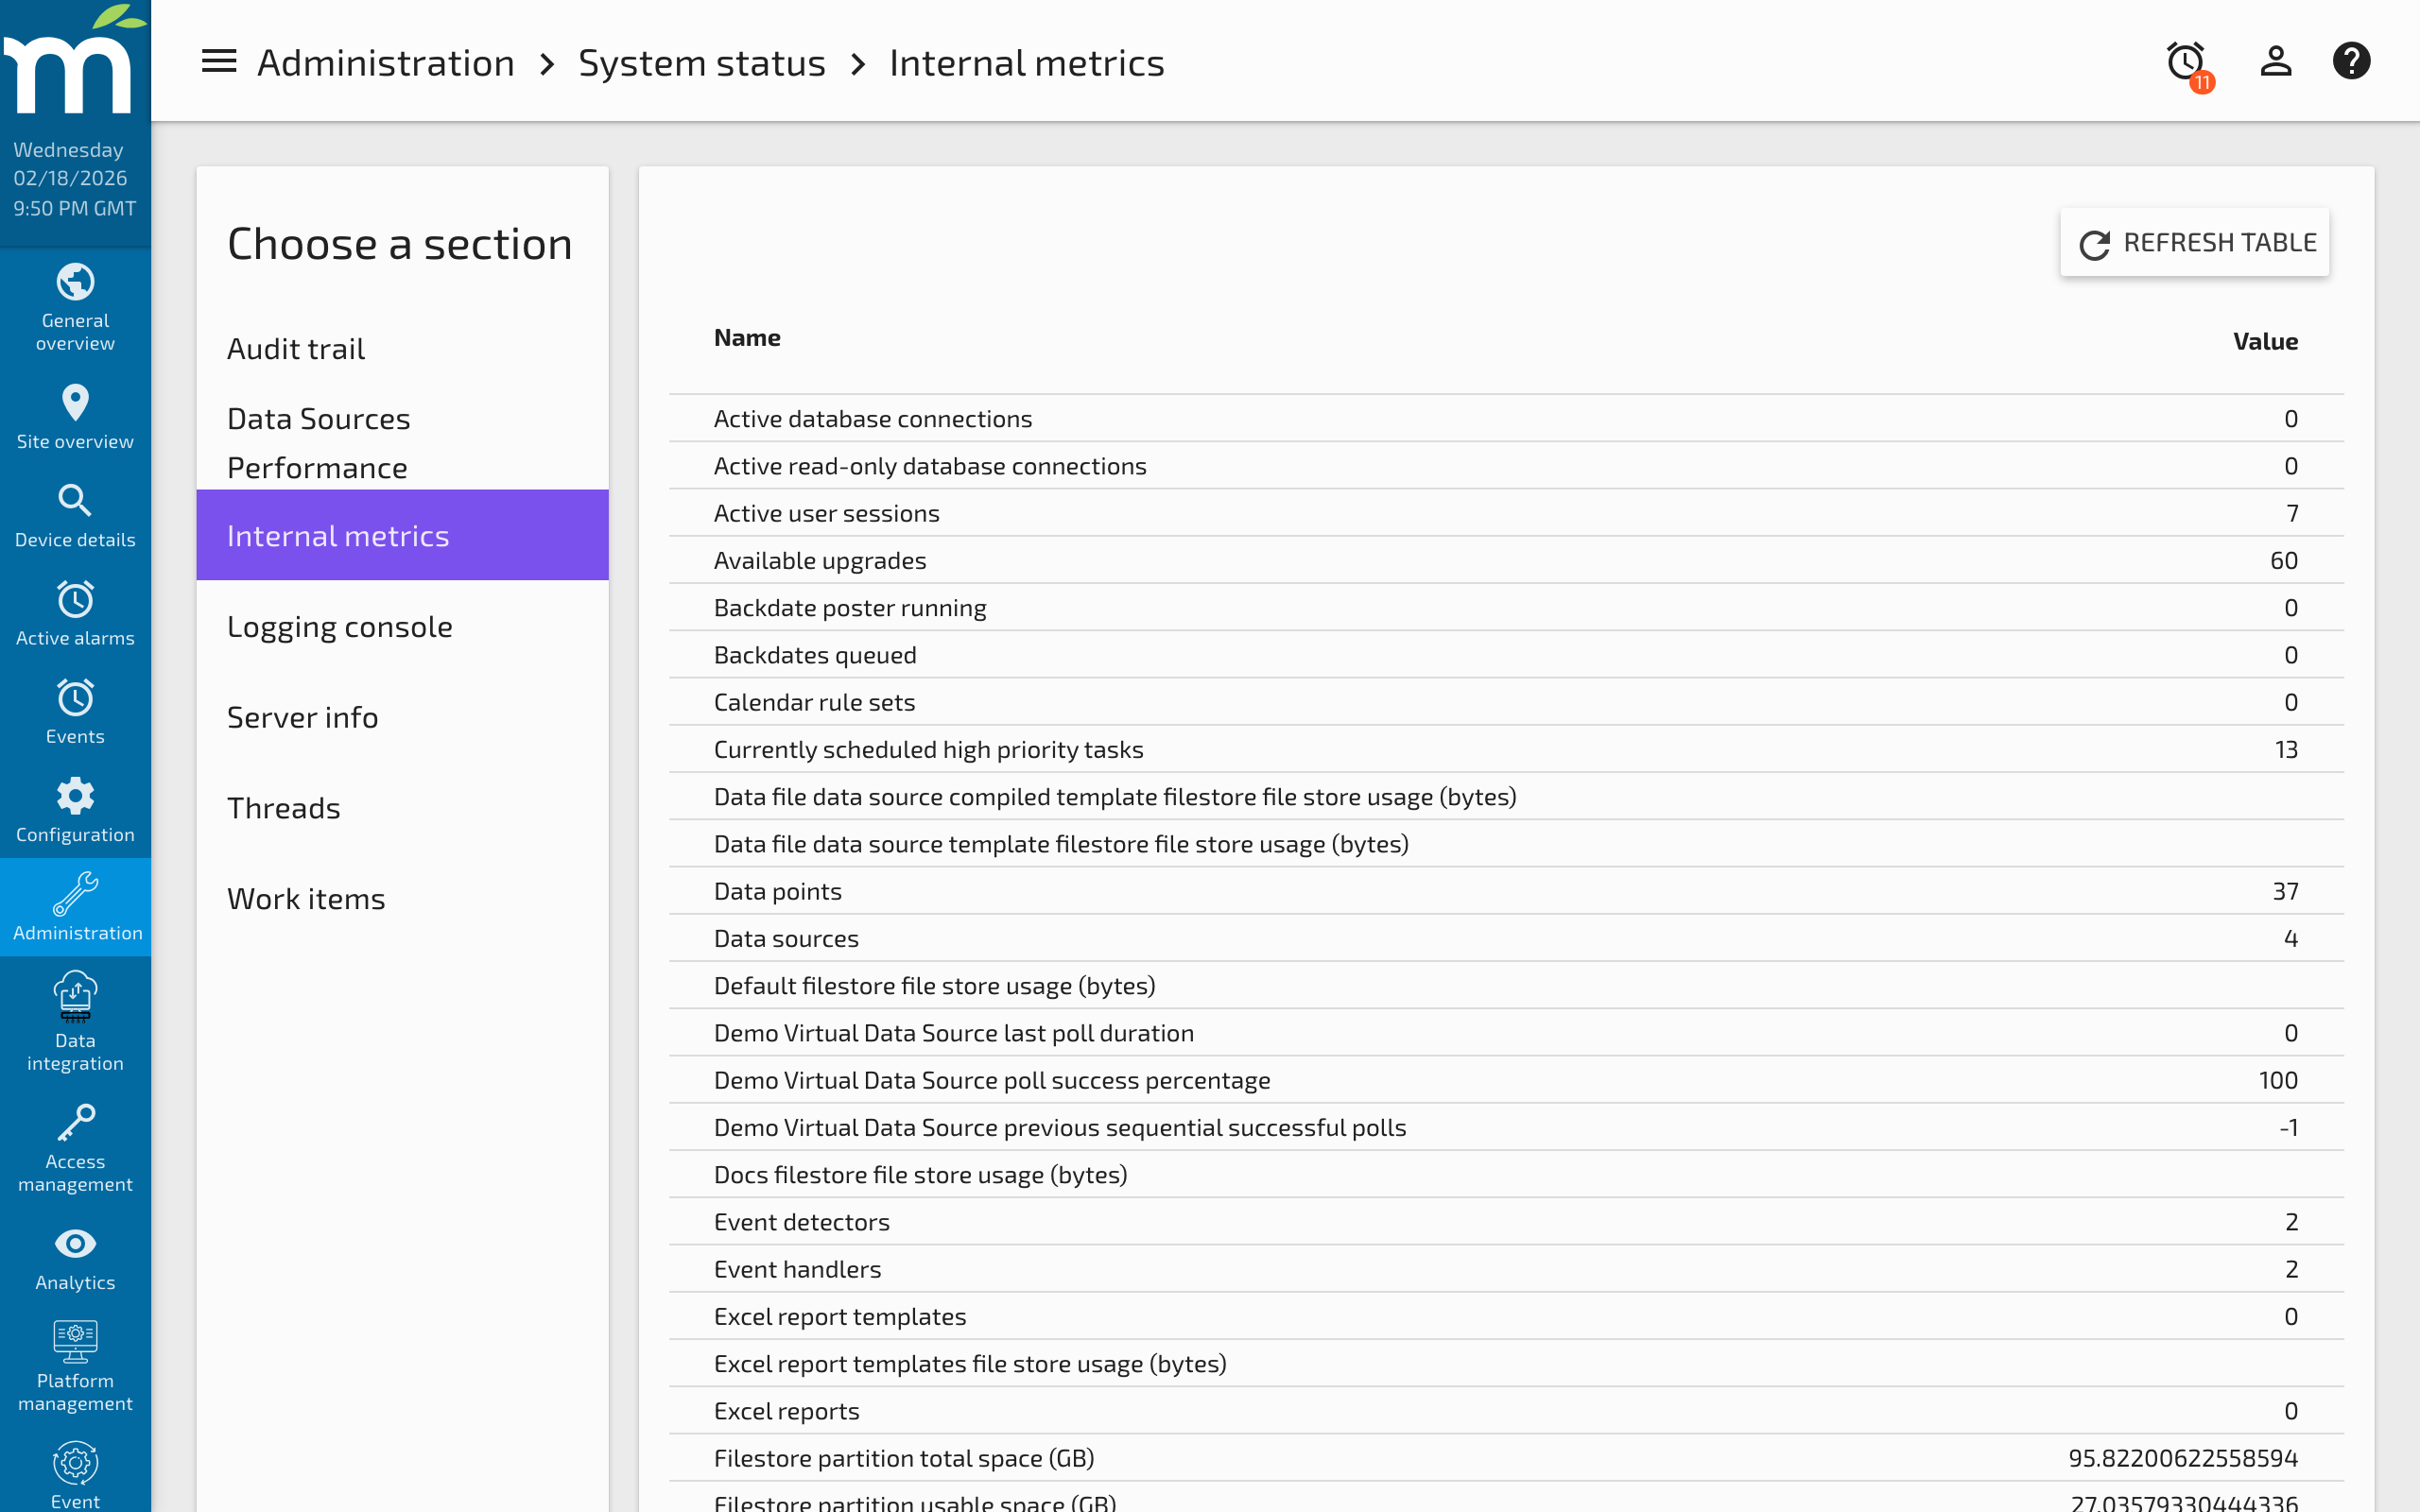
The Internal Metrics page (Administration > System Status > Internal Metrics) displays real-time statistics about the Mango runtime, including memory usage, database connections, thread activity, and write throughput. These metrics are essential for monitoring system health, diagnosing performance issues, and planning capacity.
The table can be refreshed on demand and sorted by name or value.
Metric Descriptions
Point Values to Be Written
The number of point values currently queued in memory, waiting to be written to the database by the Batch Write Behind system. A consistently high or growing value indicates that the write system cannot keep up with incoming data. See NoSQL Database Performance Tuning for guidance on tuning write performance.
Point Value Write Threads
The number of threads actively writing point values from the queue to the database. This count should be at or below the configured Max batch write behind tasks setting.
High Priority Work Items Currently Running
The number of high-priority tasks currently executing. High-priority tasks include:
- Database batch write behind -- Writing point values from the queue.
- Process Work Item -- Event handlers that execute a system process.
- Set Point Work Item -- Setting a point value asynchronously (e.g., from a Point Link).
- HttpImageRetriever -- Retrieving images for HTTP Image data sources.
- BACnet Device Poller -- Polling BACnet devices.
- Polling Data Sources -- Each data source poll operation.
- Interval Logging -- Interval-based logging of point values.
Medium Priority Work Items
The number of queued medium-priority work items awaiting execution. The medium-priority pool queue is unbounded and can grow indefinitely. Items include:
- Event Notify Work Item -- Notifying listeners when data points are saved or updated.
- Backups -- Database and configuration backup operations.
- Audit Event -- Recording configuration changes to the audit trail.
Low Priority Work Items
Low-priority tasks run in a separate pool that is not bounded. Items include:
- Reports and Excel Reports
- Email -- Sending email notifications.
- Event Notify Work Item -- Alarm state change notifications.
Currently Scheduled High Priority Work Items
The number of high-priority tasks that are scheduled to run at a future time (e.g., the next data source poll, a scheduled backup).
Maximum Thread Stack Height
The largest thread stack depth of any thread within the Mango JVM. An extremely deep stack may indicate recursive operations or deeply nested calls.
Active Thread Count
The total number of active threads in the JVM, including all thread pools and system threads.
Active Database Connections
The number of active connections in the JDBC connection pool. Only meaningful when using JDBC pooling (e.g., with MySQL or PostgreSQL). An unusually high number may indicate connection leaks or long-running queries.
Idle Database Connections
The number of idle connections in the JDBC pool, ready to serve new requests.
Writes Per Second During Database Batches
The throughput rate of point values being written to the database when the write queue has values pending. This metric helps you understand your system's write capacity and whether it can sustain the incoming data rate.
JVM Free Memory
The amount of memory available in the JVM heap before it needs to grow. Low free memory combined with high used memory may trigger garbage collection pauses.
JVM Used Memory
The current amount of heap memory actively in use by Mango.
JVM Max Memory
The maximum amount of heap memory the JVM is allowed to use. This is controlled by the -Xmx JVM argument in the Mango startup configuration.
JVM Available Processors
The number of CPU cores available to the JVM. This determines the potential parallelism for thread pools and background tasks.
Monitoring Best Practices
- Check "Point values to be written" regularly. A value that trends upward over time indicates a write bottleneck that will eventually lead to data loss events.
- Compare write threads to the configured maximum. If all write threads are consistently active, consider increasing the pool size and the high-priority thread pool.
- Monitor JVM memory. If used memory approaches max memory, increase the heap size or investigate memory leaks using a heap dump (see Linux Diagnostic Information).
- Use the Internal Data Source module to create data points that track these metrics over time, allowing you to detect trends and set up alarm thresholds.
Related Pages
- Work Items — Detailed breakdown of task queues, rejections, and thread pool configuration
- Threads — View individual thread states and stack traces for performance diagnosis
- NoSQL Database Performance Tuning — Tune the batch write-behind system based on write throughput metrics
- Linux Diagnostic Information — JVM-level diagnostics including heap dumps and flight recordings
- Server Information — Database size, point counts, and system version details