Server Information
The Server Info page (Administration > System Status > Server Info) provides a snapshot of key system details and database statistics. This information is useful for verifying system configuration, monitoring resource usage, and providing details to Radix IoT support when troubleshooting issues.
System Details
The Server Info page displays the following information:
| Field | Description |
|---|---|
| Mango Version | The currently installed version of Mango |
| Time Zone | The JVM's configured timezone, which affects how timestamps are displayed |
| Database Type | The relational database engine in use (H2, MySQL, PostgreSQL) |
| Database Size | The current storage space consumed by the relational database |
| Operating System | The host operating system name and version |
| Java Version | The JVM runtime version |
| Uptime | How long Mango has been running since the last restart |
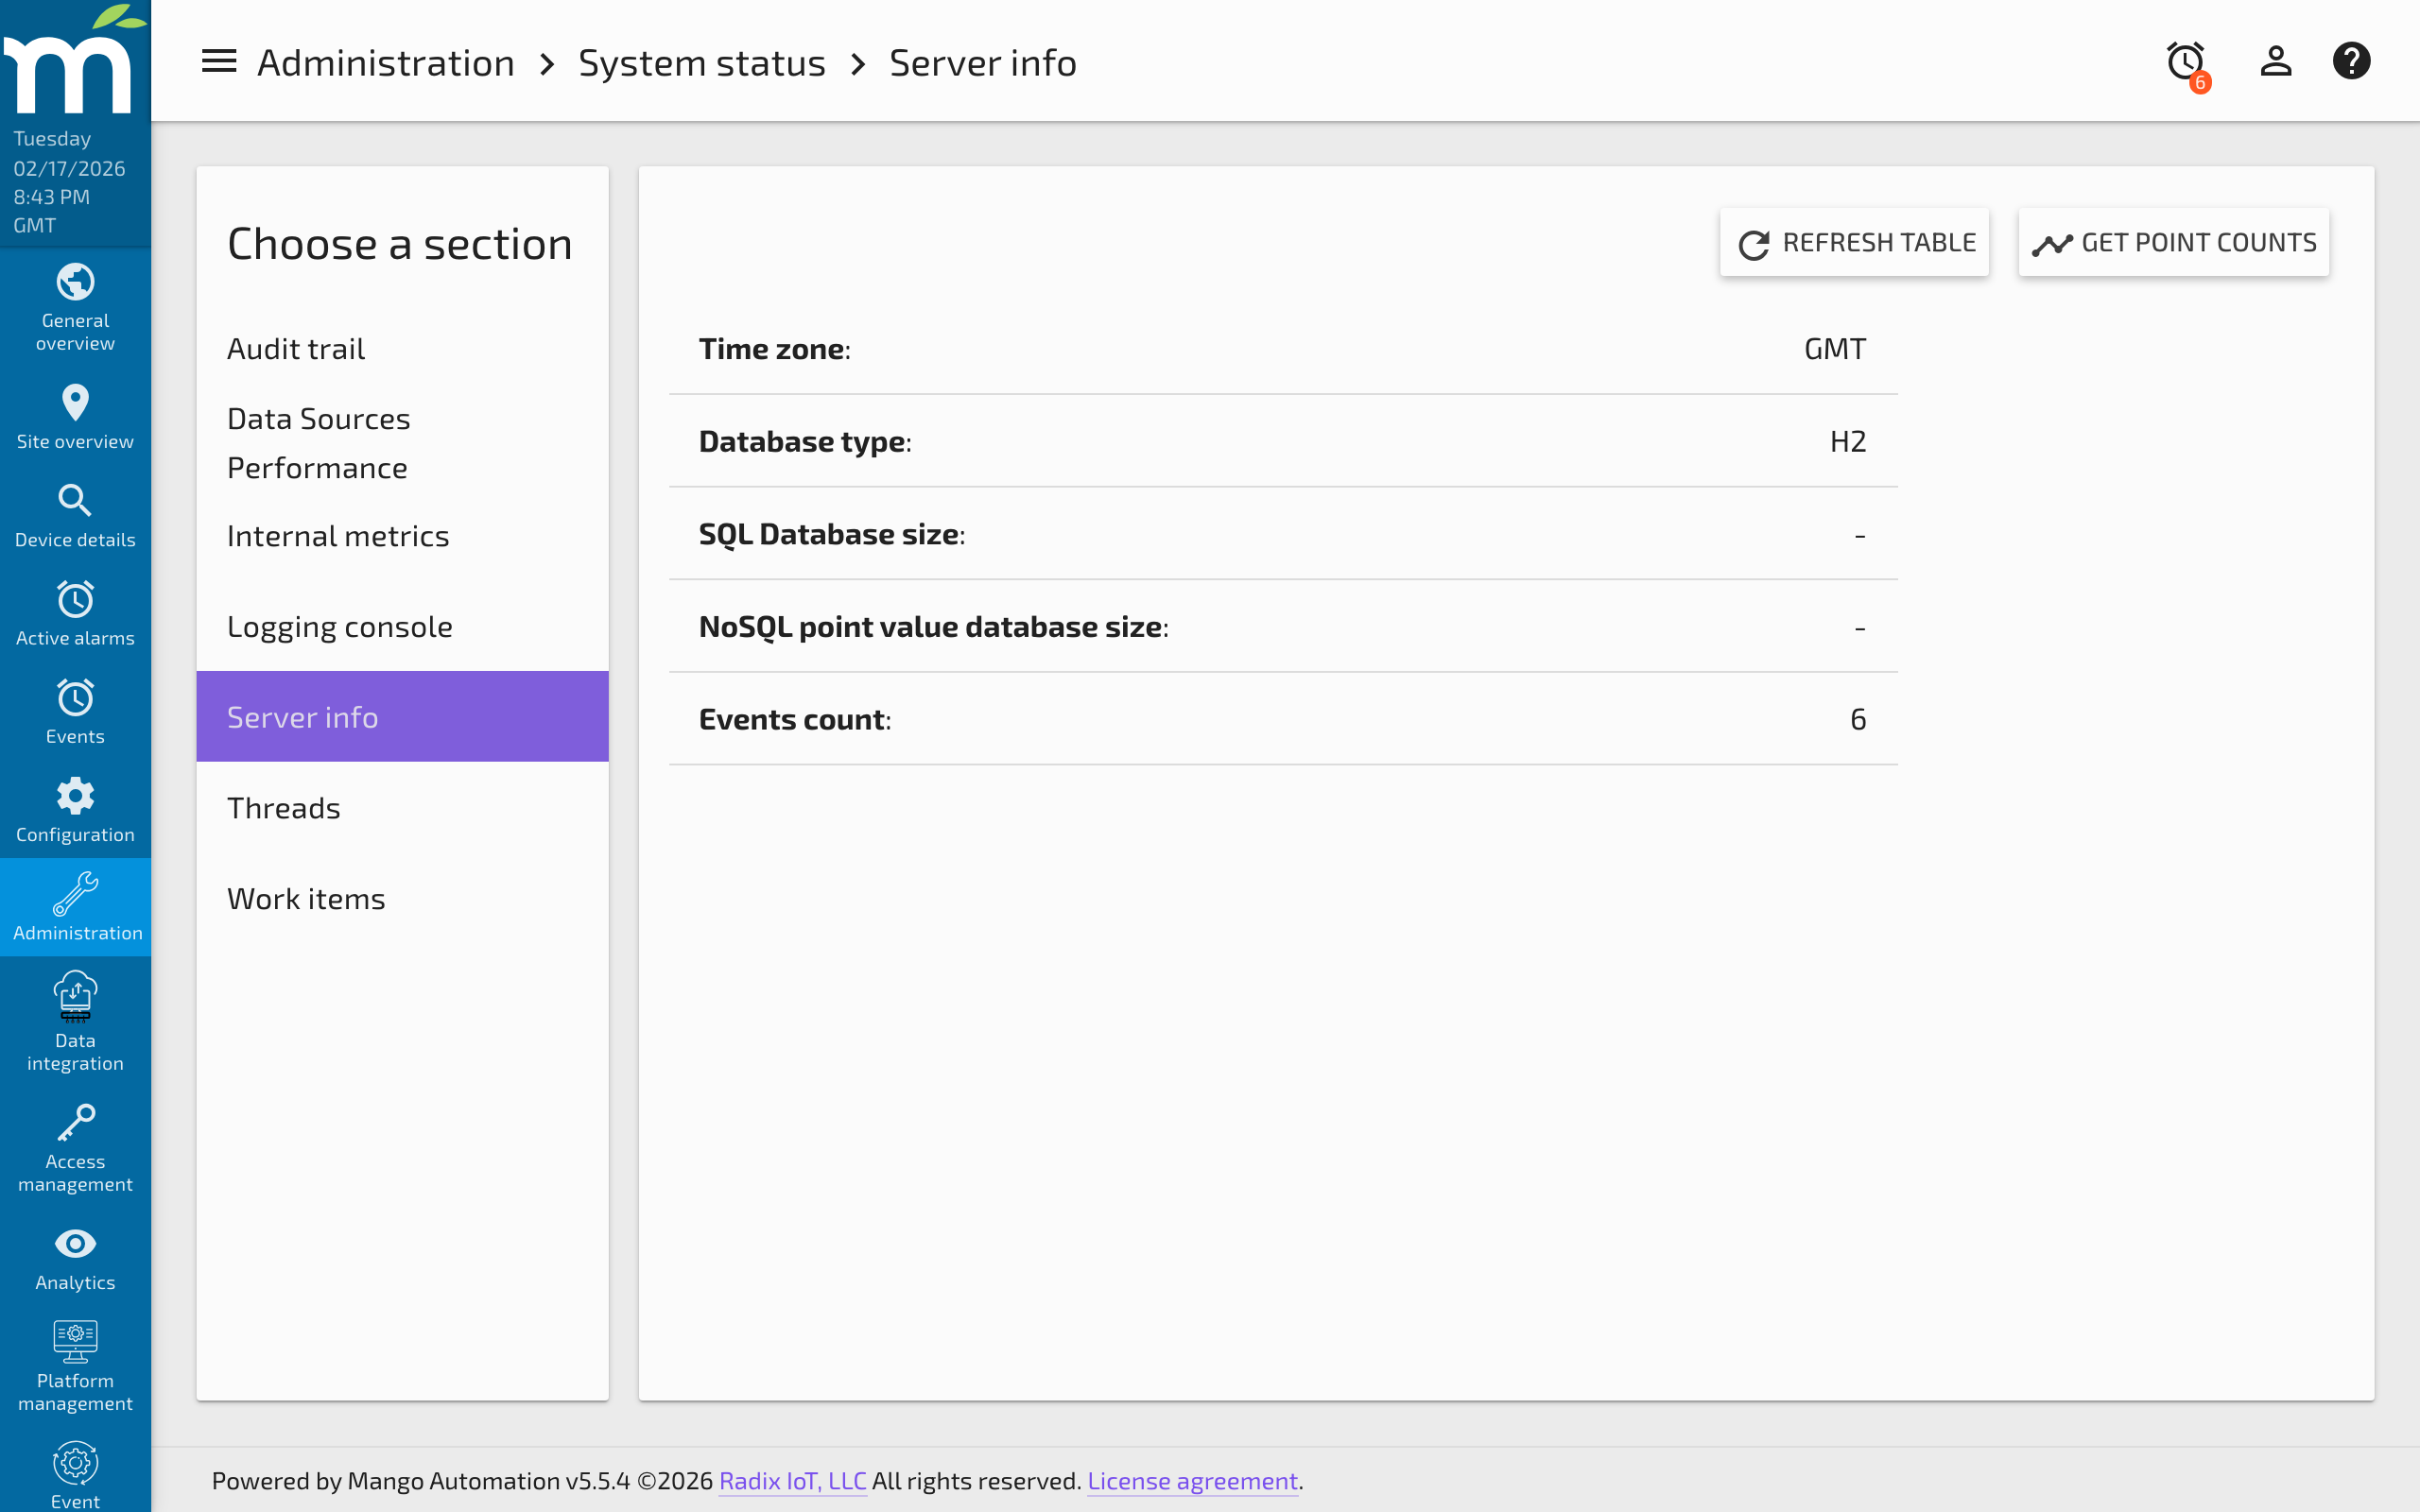
Database Size
The Database size reflects the amount of disk space consumed by the Mango relational database (H2 or MySQL). The majority of this space is typically taken up by:
- Events table -- Alarm and event records. Events accumulate over time and are purged based on the system purge settings.
- Report instances -- Saved report data, if the Reports module is installed.
- Point values -- Only if the NoSQL module is not installed; otherwise, point values are stored in the separate NoSQL time-series database.
To minimize database size, configure the purging settings for each of these items as aggressively as practical under System Settings > Purge Settings. Individual data sources and data points can override the system-level purge settings.
For more information on preventing disk space issues, see Managing Disk Space.
Point Counts
Click the Get Point Counts button to view a table showing how many historical values are stored for each data point. This helps identify:
- Points with excessive history -- A point with millions of values may be logging too frequently or has not been purged in a long time.
- Storage distribution -- Understanding which points consume the most storage helps prioritize purge configuration.

The table can be sorted by Point Name, Point ID, or Count to quickly find the largest consumers of storage.
Using Server Info for Support
When contacting Radix IoT support, include the following details from this page:
- Mango version
- Database type and size
- Java version
- Operating system
- Uptime (relevant for diagnosing memory leaks or gradual performance degradation)
This information helps the support team quickly understand your environment and narrow down potential issues.
Related Pages
- Internal Metrics — Real-time runtime statistics including memory, threads, and write throughput
- Managing Disk Space — Strategies for managing database size and historical data
- Using the SQL Console — Query database tables directly for detailed size and record analysis
- About the H2 Database — Understand the default H2 database shown on the Server Info page
- Linux Diagnostic Information — Advanced JVM diagnostics for memory and performance issues