Threads
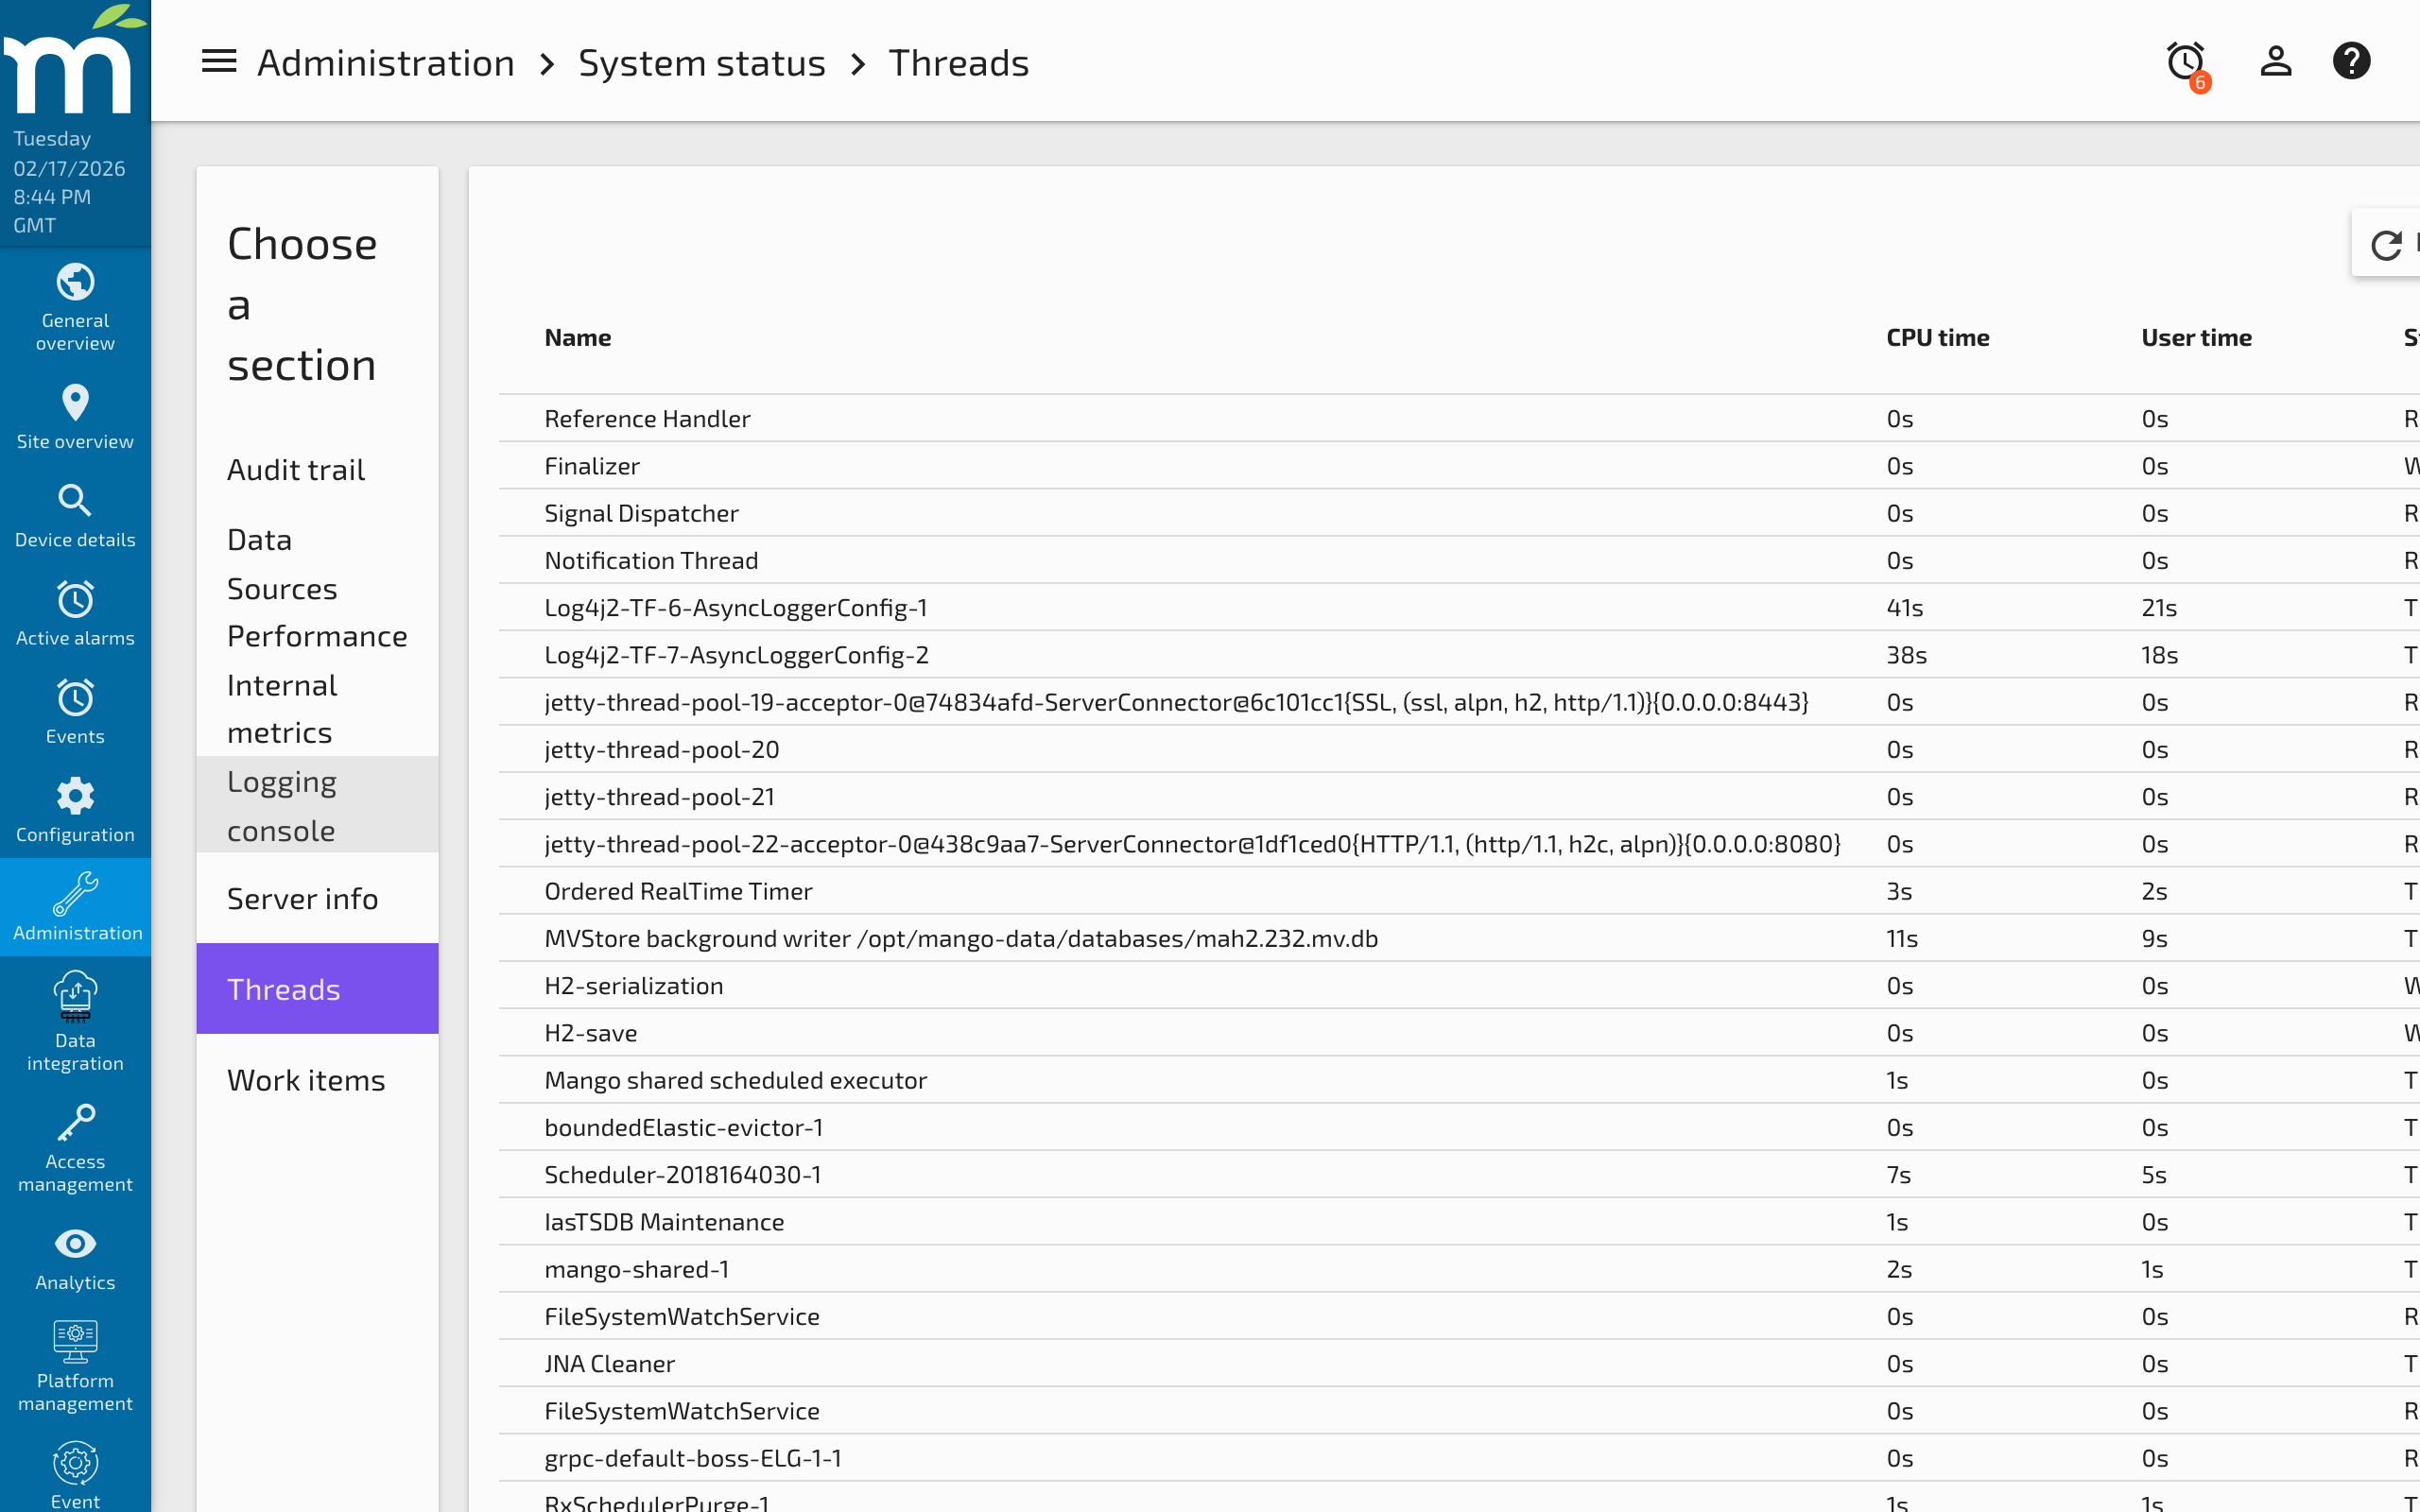
The Threads page (Administration > System Status > Threads) shows all processor threads running inside the Mango JVM. This is a critical diagnostic tool for identifying performance bottlenecks, deadlocks, and runaway tasks.
Viewing Threads
The threads table displays every active thread along with sortable columns for:
| Column | Description |
|---|---|
| Name | The thread name, which typically identifies its purpose (e.g., Polling-DataSource-1, medium-priority-pool-thread-3) |
| CPU Time | Total CPU time consumed by the thread since it was created |
| User Time | CPU time spent in user-mode code (excludes kernel time) |
| State | Current thread state: RUNNABLE, WAITING, TIMED_WAITING, or BLOCKED |
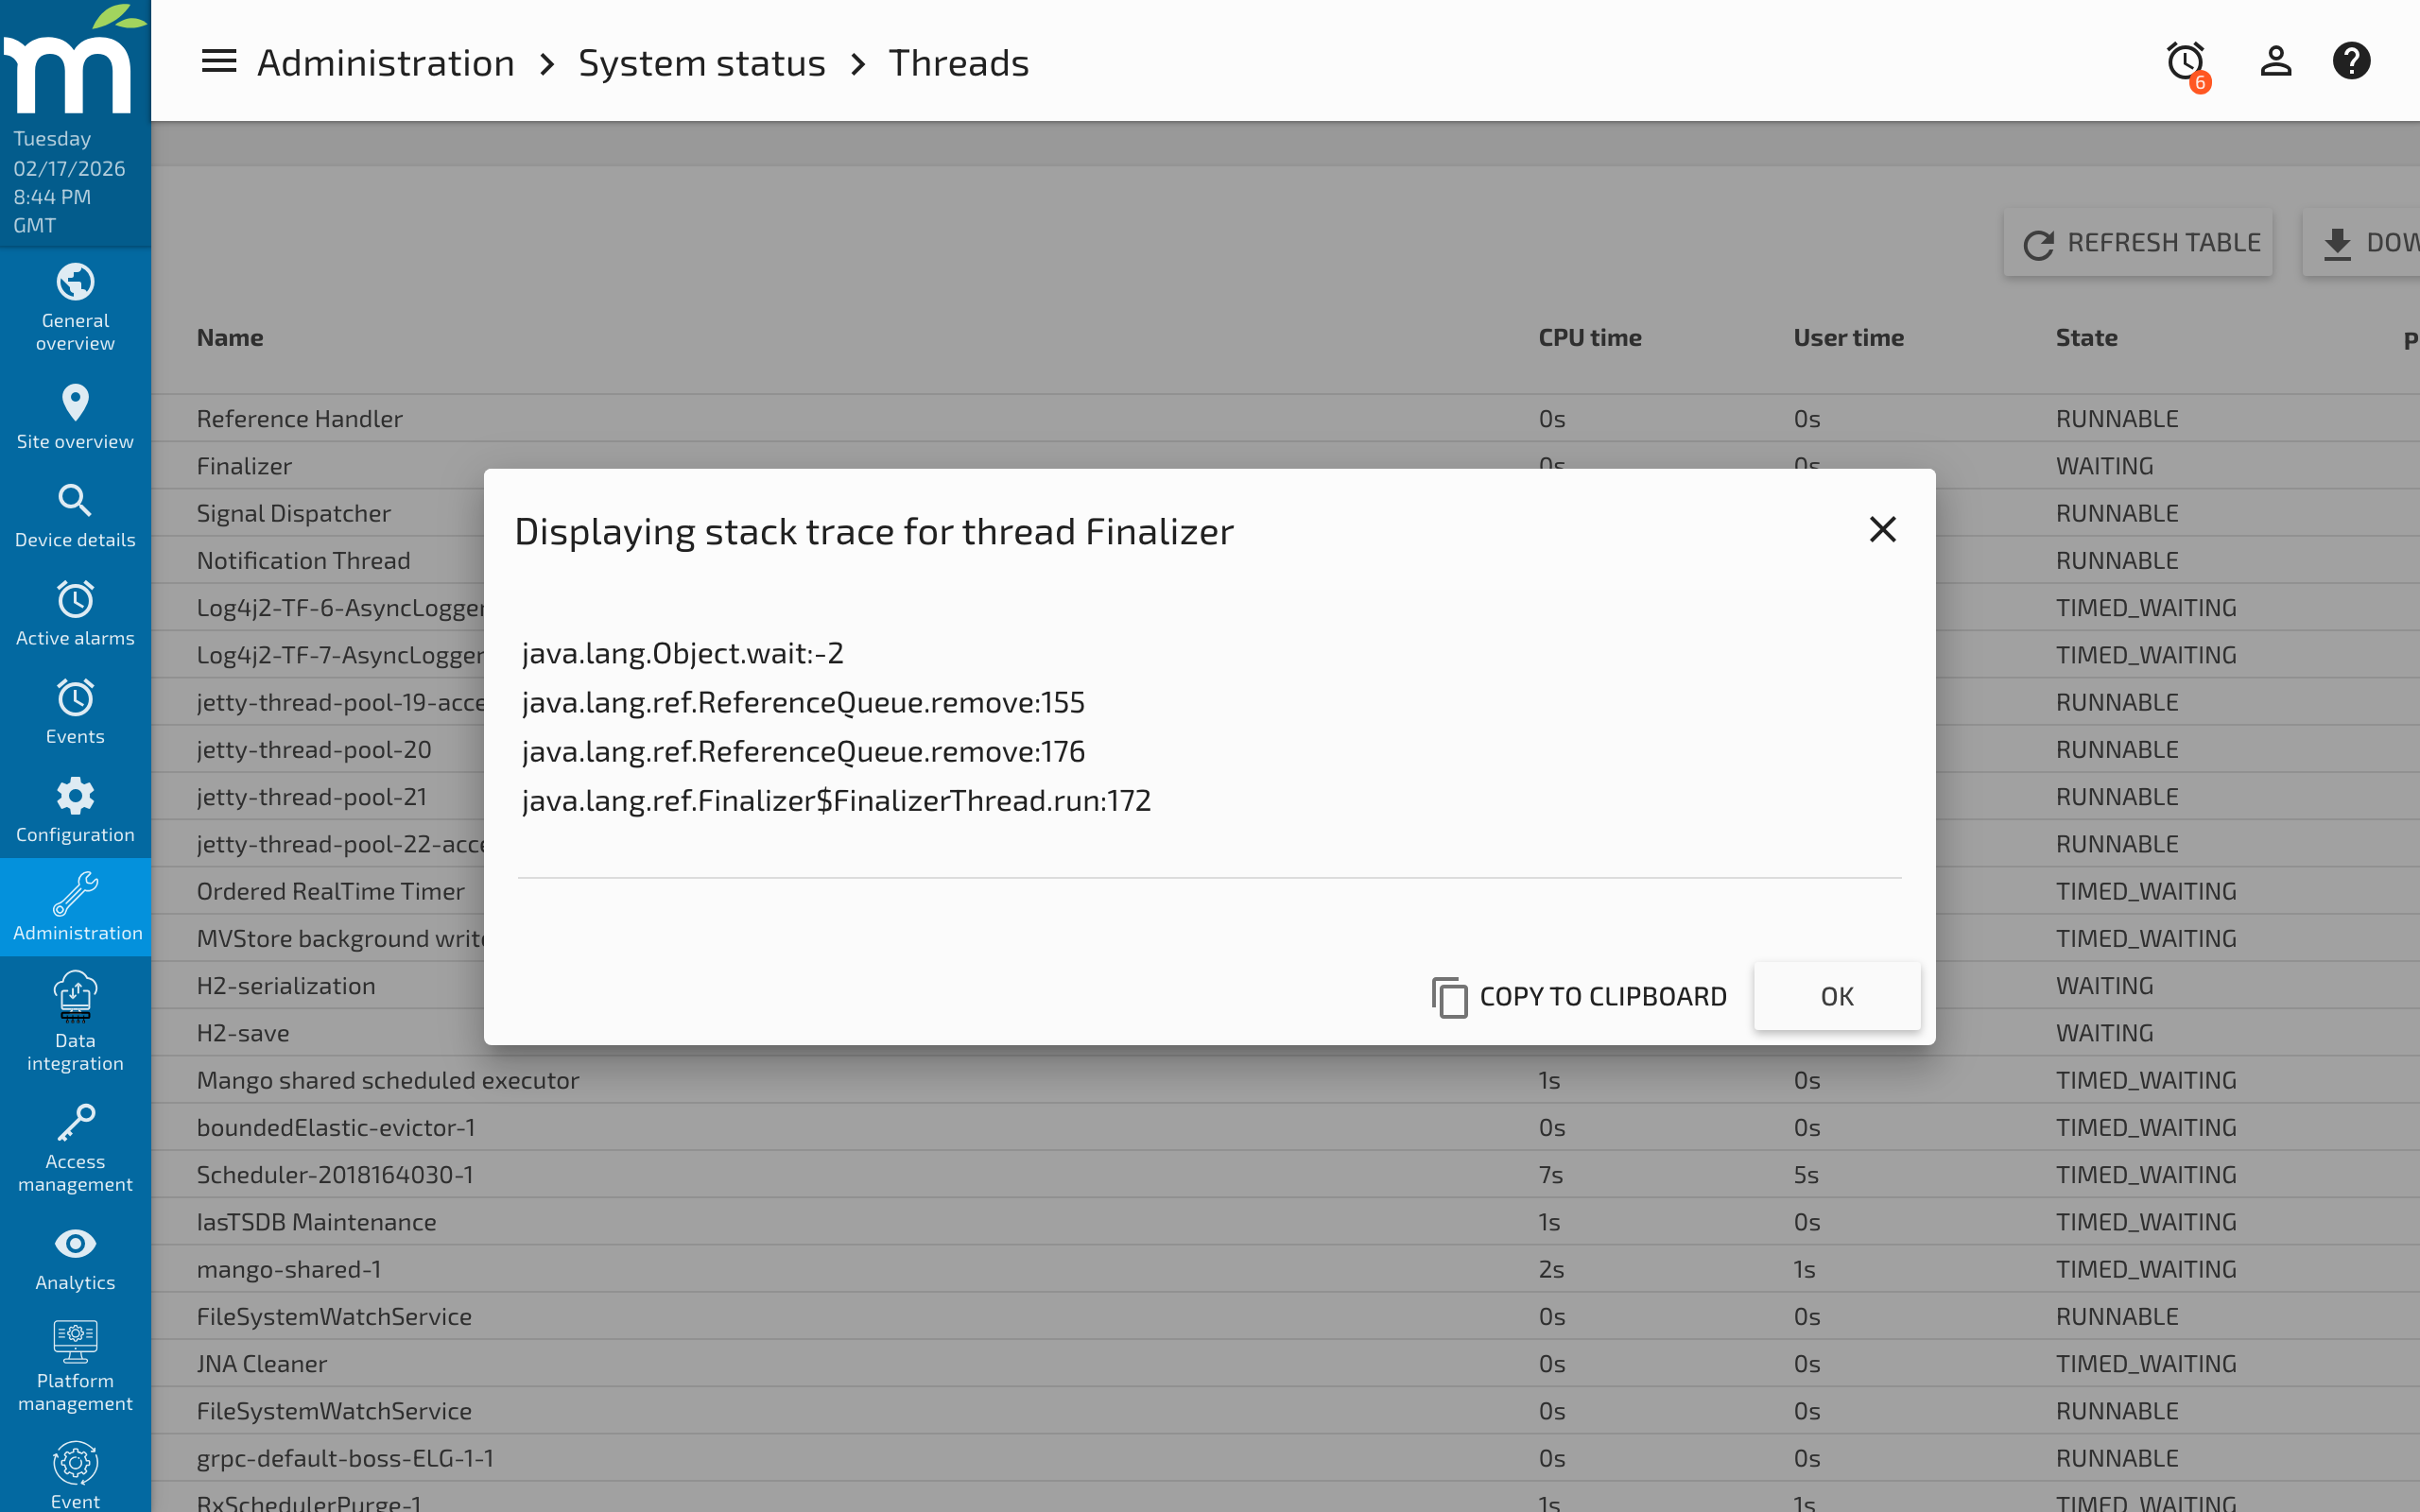
Viewing Stack Traces
Click any row in the threads table to view the Stack Trace for that thread. The stack trace shows the exact call chain the thread is executing, from the current method down to the thread entry point. This is invaluable for diagnosing:
- Blocked threads -- If a thread is in
BLOCKEDstate, the stack trace shows which lock it is waiting to acquire and which thread holds that lock. - Long-running operations -- A thread stuck in the same method across multiple refreshes may indicate an infinite loop, a slow database query, or a network timeout.
- Deadlocks -- Two or more threads each waiting for a lock held by the other.
Common Mango Threads
Understanding what each thread does helps you interpret the thread list:
| Thread Name Pattern | Purpose |
|---|---|
high-priority-pool-thread-* | Executes data source polling, event detection, and batch writes |
medium-priority-pool-thread-* | Handles backups, audit events, and data point notifications |
low-priority-pool-thread-* | Processes emails, reports, and alarm notifications |
Polling-DataSource-* | Scheduled polling timers for individual data sources |
NoSQL-BatchWrite-* | Background threads writing point values to the NoSQL store |
WebSocket-* | Manages real-time UI updates via WebSocket connections |
http-* | Jetty HTTP server threads handling web requests |
Downloading Thread Dumps
Click the Download Thread Dump button to export the entire thread dump as a JSON file. This is useful for:
- Sharing with Radix IoT support for diagnosis.
- Comparing thread states over time to identify trends.
- Archiving thread snapshots during performance investigations.
For more detailed JVM diagnostics on Linux, including jstack and flight recordings, see Linux Diagnostic Information.
Diagnosing Thread Issues
High CPU Usage
Sort threads by CPU Time to identify the most active threads. If a single thread is consuming far more CPU than others, examine its stack trace to understand what operation it is performing. Common causes include complex scripting data points, aggressive polling rates, or large report generation.
Thread Pool Exhaustion
If the high-priority pool is fully utilized, new tasks will be rejected. You can monitor this on the Work Items page. Increase the pool size in System Settings if necessary, but also investigate why tasks are accumulating -- the root cause may be slow data source responses, disk I/O bottlenecks, or misconfigured polling rates.
Waiting Threads
A large number of threads in WAITING or TIMED_WAITING state is normal -- these are idle threads in pools waiting for work. However, threads in BLOCKED state indicate contention that may degrade performance.
Related Pages
- Work Items — Understand task queues, thread pool configuration, and task rejections
- Internal Metrics — Monitor active thread counts, write threads, and JVM resource usage
- Linux Diagnostic Information — Capture thread dumps and flight recordings from the command line
- Debug Log Settings — Enable debug logging for specific subsystems to correlate with thread activity
- NoSQL Database Performance Tuning — Tune NoSQL batch write threads visible in the thread list