Data Point Details
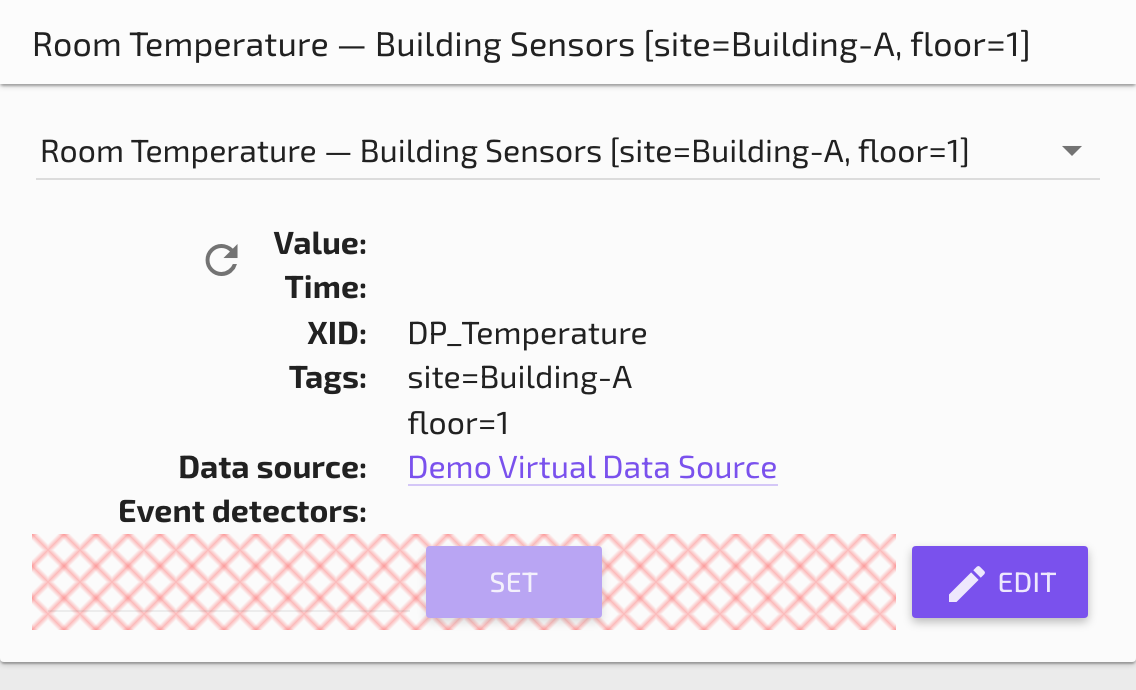
The Data Point Details page allows you to thoroughly examine a single Data Point. A data point can be selected using the filtering input in the upper left pane. You can filter the list and get a dropdown by typing either the point's Name or Device Name (case sensitive). The results update as you type. The Path shows the location of the point in the Point Hierarchy. You can set a point's value, force a read using the Refresh icon, or jump to the data point Edit page from this pane.
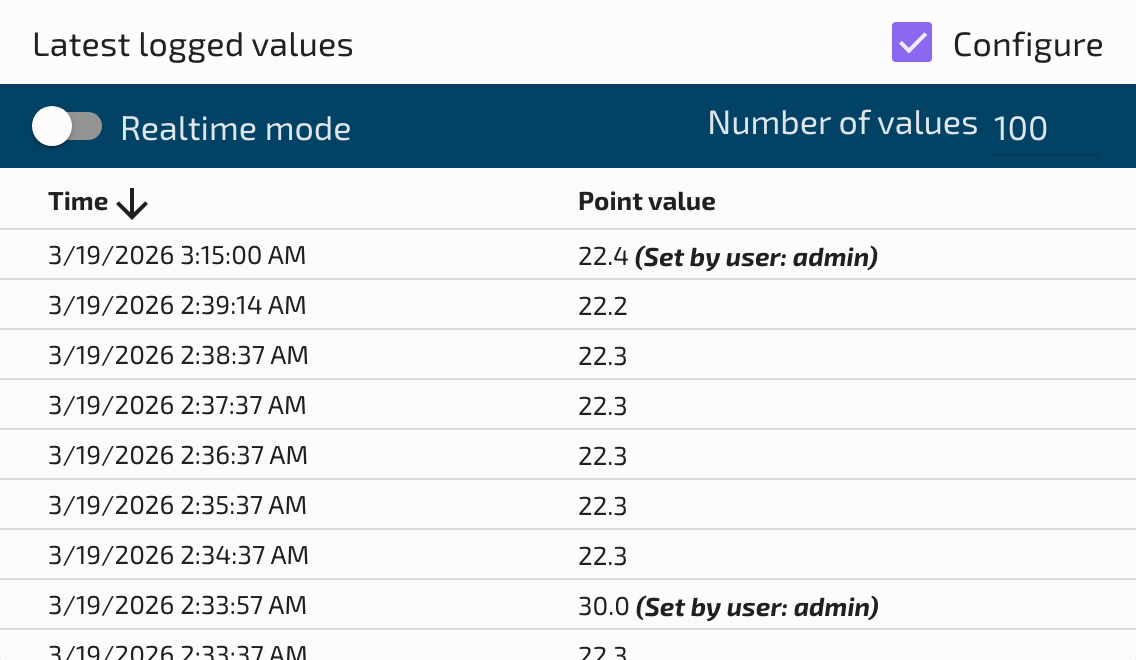
Point Value History
The Point Value History table shows the point's values either in Realtime mode or over the selected time range and rollup settings from the Date Bar. To change these settings, check the Configure option and turn on or off the Realtime toggle. You can set the Number of values to display as well as whether to Show cached data. Values are recorded in the browser without expanding the cache. So if a point had a Default cache size equal to the Number of values to display, this table would open filled. But if the point has a small cache, the Point Value History table will grow as new values come in.
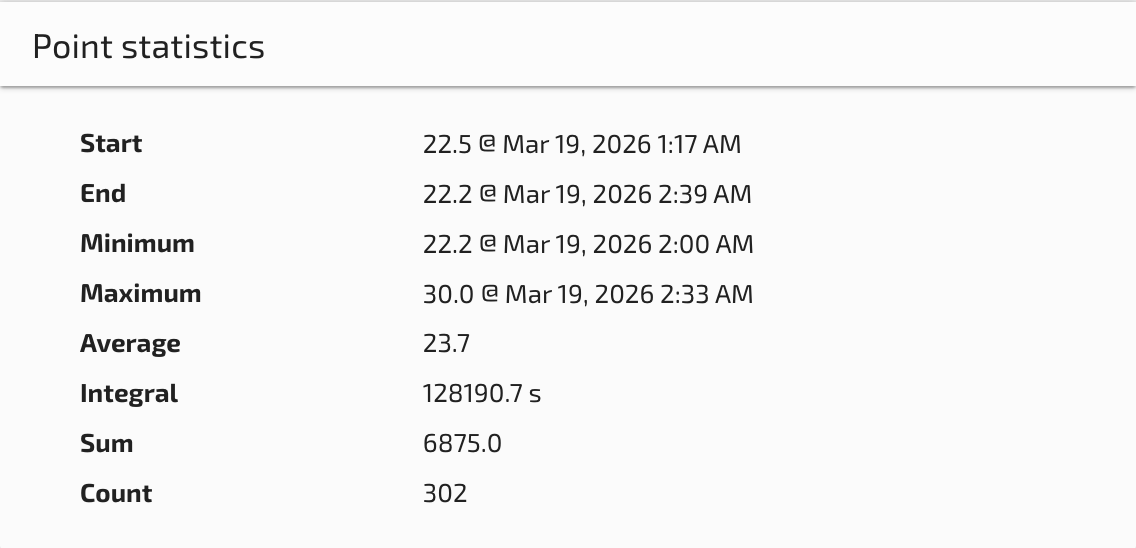
Point Statistics
The Point Statistics pane shows you statistics over the selected time range. It displays different statistics depending on the data type of the selected point:
- Numeric points -- Minimum, maximum, average, sum, count, and standard deviation.
- Binary points -- Duration of each state (true/false) and number of transitions.
- Multistate points -- Duration and percentage of time spent in each state.
- Alphanumeric points -- Count of value changes.
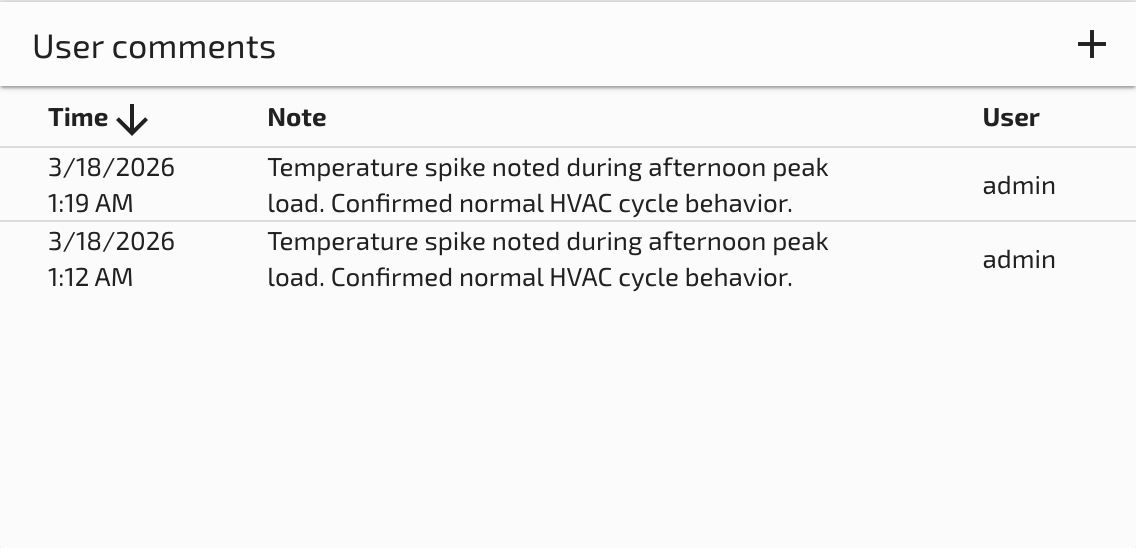
User Comments
The User Comments pane shows any user notes specific to the selected data point. Click the + button to enter a new note for the data point and it will appear in the table. Comments are useful for annotating maintenance events, unusual readings, or operational notes that should be associated with a specific data point.
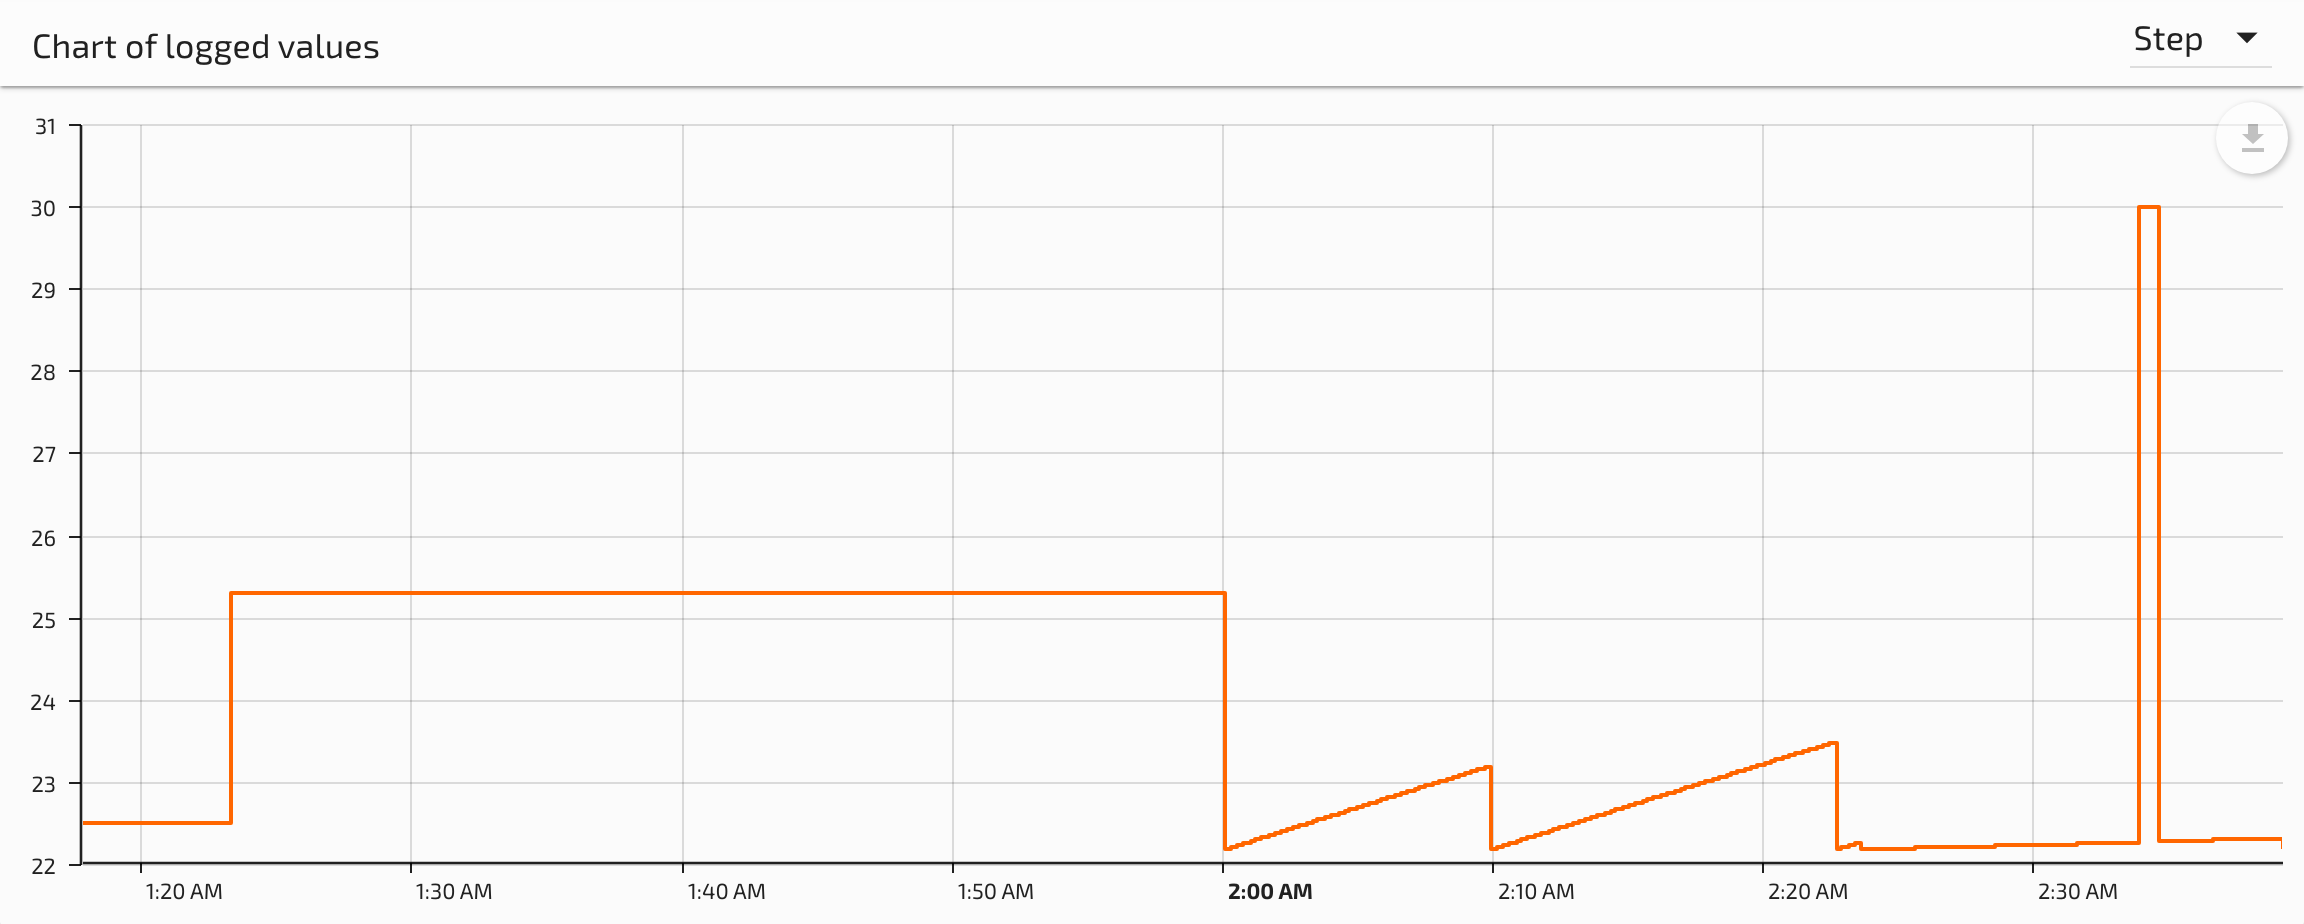
Chart
The Chart provides a visualization of the data point's values over the selected time range. The Rollup settings from the Date Bar are used to aggregate the data if necessary. You can choose between different chart types and line smoothing options using the dropdown selector in the upper right corner. Additionally, you can export an image or data file by clicking the download icon hovering over the upper right corner of the chart.
Available chart types include:
- Line chart -- Standard time-series line graph, ideal for numeric trends.
- Bar chart -- Useful for comparing discrete values or rollup periods.
- Step chart -- Displays values as horizontal steps, appropriate for binary and multistate points.
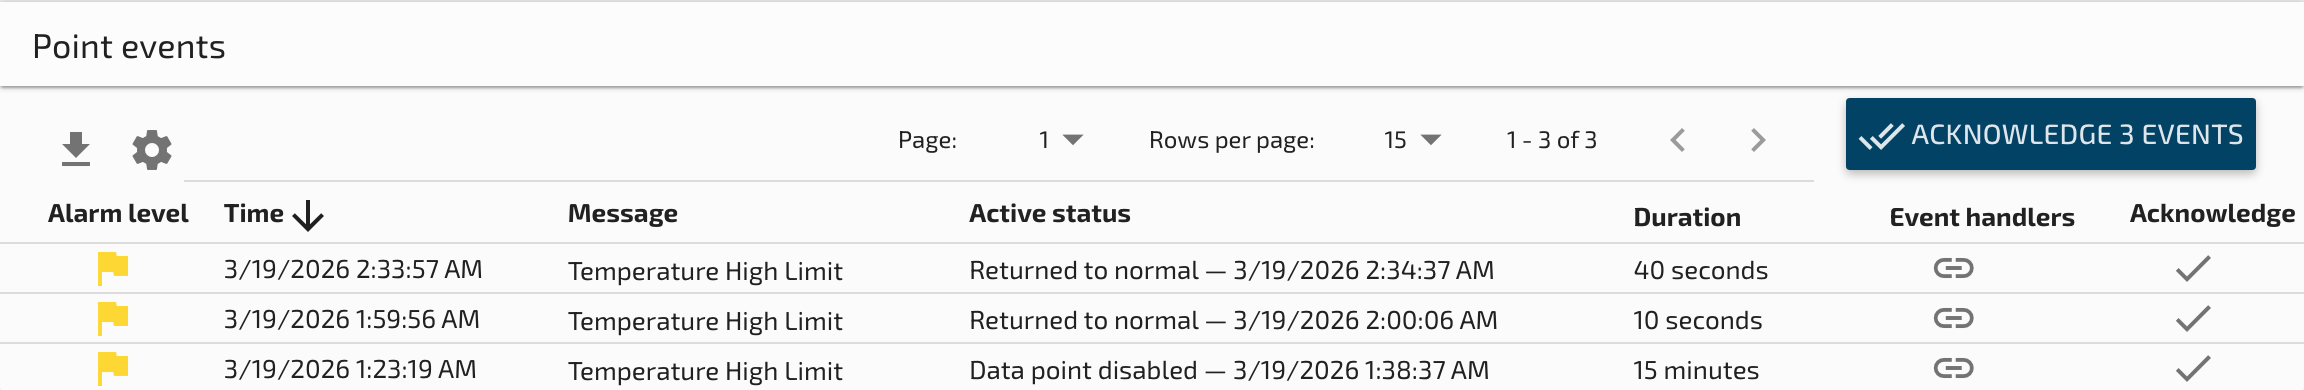
Point Events
At the bottom of the page you will see any Events specific to the selected data point. These are events triggered by event detectors configured on the point, such as high-limit, low-limit, or state change detectors. See the Events Page for more information on the events table and how to filter and acknowledge events.
Related Pages
- Date Bar — Adjust the time range for viewing point value history
- Events Page — View all system events including those for this data point
- What Is a Data Point? — Introduction to data points in Mango
- How to Set Data Point Values — Write values back to settable data points